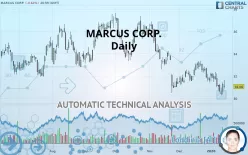
MARCUS CORP. - Daily - Technical analysis published on 01/16/2020 (GMT)
- 259
- 0
- Who voted?
Click here for a new analysis!
- Timeframe : Daily
- - Analysis generated on
- Status : TARGET REACHED

Summary of the analysis

Additional analysis
Quotes
MARCUS CORP. rating 31.06 USD. The price is lower by -0.64% since the last closing and was between 30.85 USD and 31.63 USD. This implies that the price is at +0.68% from its lowest and at -1.80% from its highest.The Central Gaps scanner detects a bearish opening marking the presence of sellers ahead of buyers at the opening but not sufficiently marked to allow the price to register a quotation gap.
Bearish opening
Type : Bearish
Timeframe : Openning
Here is a more detailed summary of the historical variations registered by MARCUS CORP.:
Near a new LOW record (1 year)
Type : Bearish
Timeframe : Weekly
Technical
A technical analysis in Daily of this MARCUS CORP. chart shows a sharp bearish trend. The signals given by moving averages are 92.86% bearish. This strong bearish trend is confirmed by the strong signals currently being given by short-term moving averages. The Central Indicators scanner does not detect any result on moving averages that would impact this trend.
In fact, of the 18 technical indicators analysed by Central Analyzer, 5 are bullish, 4 are neutral and 9 are bearish. But beware of excesses. The Central Indicators scanner currently detects this:
CCI indicator is oversold : under -100
Type : Neutral
Timeframe : Daily
CCI indicator: bullish divergence
Type : Bullish
Timeframe : Daily
Price is back over the pivot point
Type : Bullish
Timeframe : Daily
Price is back under the pivot point
Type : Bearish
Timeframe : Weekly
Central Patterns, the market scanner focusing on chart patterns, resistances and supports found this result:
Near horizontal support
Type : Bullish
Timeframe : Daily
The Central Candlesticks scanner, specialised in Japanese candlesticks, did not identify any signals.
| S3 | S2 | S1 | Price | R1 | R2 | R3 | |
|---|---|---|---|---|---|---|---|
| ProTrendLines | 20.17 | 24.15 | 26.40 | 31.06 | 31.09 | 33.69 | 34.60 |
| Change (%) | -35.06% | -22.25% | -15.00% | - | +0.10% | +8.47% | +11.40% |
| Change | -10.89 | -6.91 | -4.66 | - | +0.03 | +2.63 | +3.54 |
| Level | Minor | Major | Minor | - | Intermediate | Major | Minor |
Attention could also be paid to pivot points to set price objectives:
| Pivot points | S3 | S2 | S1 | PP | R1 | R2 | R3 |
|---|---|---|---|---|---|---|---|
| Standard | 29.50 | 29.91 | 30.59 | 31.00 | 31.68 | 32.09 | 32.77 |
| Camarilla | 30.96 | 31.06 | 31.16 | 31.26 | 31.36 | 31.46 | 31.56 |
| Woodie | 29.63 | 29.98 | 30.72 | 31.07 | 31.81 | 32.16 | 32.90 |
| Fibonacci | 29.91 | 30.33 | 30.59 | 31.00 | 31.42 | 31.68 | 32.09 |
| Pivot points | S3 | S2 | S1 | PP | R1 | R2 | R3 |
|---|---|---|---|---|---|---|---|
| Standard | 28.15 | 29.33 | 29.99 | 31.17 | 31.83 | 33.01 | 33.67 |
| Camarilla | 30.13 | 30.30 | 30.47 | 30.64 | 30.81 | 30.98 | 31.15 |
| Woodie | 27.88 | 29.20 | 29.72 | 31.04 | 31.56 | 32.88 | 33.40 |
| Fibonacci | 29.33 | 30.04 | 30.47 | 31.17 | 31.88 | 32.31 | 33.01 |
| Pivot points | S3 | S2 | S1 | PP | R1 | R2 | R3 |
|---|---|---|---|---|---|---|---|
| Standard | 28.75 | 30.00 | 30.88 | 32.13 | 33.01 | 34.26 | 35.14 |
| Camarilla | 31.18 | 31.38 | 31.58 | 31.77 | 31.97 | 32.16 | 32.36 |
| Woodie | 28.58 | 29.91 | 30.71 | 32.04 | 32.84 | 34.17 | 34.97 |
| Fibonacci | 30.00 | 30.81 | 31.31 | 32.13 | 32.94 | 33.44 | 34.26 |
Numerical data
The following are the details of the technical indicators and moving averages that were collected to generate this technical analysis:
| RSI (14): | 39.95 | |
| MACD (12,26,9): | -0.4500 | |
| Directional Movement: | -8.62 | |
| AROON (14): | -78.57 | |
| DEMA (21): | 31.08 | |
| Parabolic SAR (0,02-0,02-0,2): | 30.27 | |
| Elder Ray (13): | -0.19 | |
| Super Trend (3,10): | 32.68 | |
| Zig ZAG (10): | 31.06 | |
| VORTEX (21): | 0.9400 | |
| Stochastique (14,3,5): | 27.34 | |
| TEMA (21): | 31.01 | |
| Williams %R (14): | -68.65 | |
| Chande Momentum Oscillator (20): | -0.81 | |
| Repulse (5,40,3): | 0.2900 | |
| ROCnROLL: | 2 | |
| TRIX (15,9): | -0.1600 | |
| Courbe Coppock: | 8.57 |
| MA7: | 31.09 | |
| MA20: | 31.93 | |
| MA50: | 32.46 | |
| MA100: | 33.79 | |
| MAexp7: | 31.16 | |
| MAexp20: | 31.66 | |
| MAexp50: | 32.47 | |
| MAexp100: | 33.36 | |
| Price / MA7: | -0.10% | |
| Price / MA20: | -2.72% | |
| Price / MA50: | -4.31% | |
| Price / MA100: | -8.08% | |
| Price / MAexp7: | -0.32% | |
| Price / MAexp20: | -1.90% | |
| Price / MAexp50: | -4.34% | |
| Price / MAexp100: | -6.89% |
News
Don"t forget to follow the news on MARCUS CORP.. At the time of publication of this analysis, the latest news was as follows:
About author

Online


Add a comment
Comments
0 comments on the analysis MARCUS CORP. - Daily