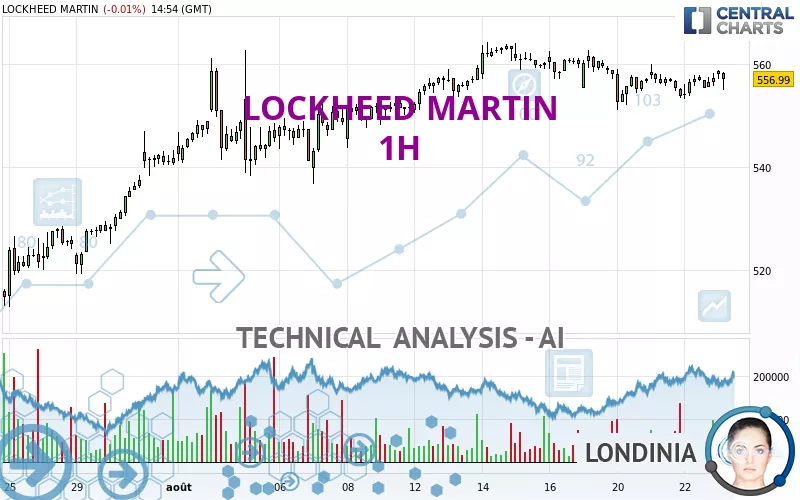
LOCKHEED MARTIN - 1H - Technical analysis published on 08/23/2024 (GMT)
- 177
- 0
Click here for a new analysis!
- Timeframe : 1H
- - Analysis generated on
- Status : LEVEL MAINTAINED
Summary of the analysis

Additional analysis
Quotes
LOCKHEED MARTIN rating 556.99 USD. The price registered a decrease of -0.01% on the session with the lowest point at 555.01 USD and the highest point at 558.87 USD. The deviation from the price is +0.36% for the low point and -0.34% for the high point.A bullish opening was detected by the Central Gaps scanner. Buyers are trying to impose a bullish momentum in the very short term.
Bullish opening
Type : Bullish
Timeframe : Openning
So that you have an overall view of the price change, here is a table showing the variations over several periods:
Near a new HIGH record (5 years)
Type : Bullish
Timeframe : Weekly
Near a new HIGH record (1 year)
Type : Bullish
Timeframe : Weekly
Near a new HIGH record (1st january)
Type : Bullish
Timeframe : Weekly
Near a new HIGH record (1 month)
Type : Bullish
Timeframe : Weekly
Technical
A technical analysis in 1H of this LOCKHEED MARTIN chart shows a bullish trend. 64.29% of the signals given by moving averages are bullish. The overall trend seems to be showing some signs of weakness, as do the tentative bullish signals given by short-term moving averages. An assessment of moving averages reveals several bearish signals that could impact this trend:
Bearish price crossover with Moving Average 20
Type : Bearish
Timeframe : 1 hour
Bearish price crossover with adaptative moving average 20
Type : Bearish
Timeframe : 1 hour
Bearish price crossover with adaptative moving average 50
Type : Bearish
Timeframe : 1 hour
Bearish price crossover with adaptative moving average 100
Type : Bearish
Timeframe : 1 hour
An assessment of technical indicators does not currently provide any relevant information on the direction of future price movements.
Central Indicators, the scanner specialised in technical indicators, has identified these signals:
RSI indicator is back under 50
Type : Bearish
Timeframe : 1 hour
Aroon indicator bullish trend
Type : Bullish
Timeframe : 1 hour
Price is back under the pivot point
Type : Bearish
Timeframe : 1 hour
Momentum indicator is back under 0
Type : Bearish
Timeframe : 1 hour
The analysis of the price chart with Central Patterns scanners does not return any result.
For a small setback in the very short term, the Central Candlesticks scanner currently notes the presence of this bearish pattern in Japanese candlesticks:
Black evening star
Type : Bearish
Timeframe : 1 hour
| S3 | S2 | S1 | Price | R1 | |
|---|---|---|---|---|---|
| ProTrendLines | 519.41 | 541.56 | 550.87 | 556.99 | 563.22 |
| Change (%) | -6.75% | -2.77% | -1.10% | - | +1.12% |
| Change | -37.58 | -15.43 | -6.12 | - | +6.23 |
| Level | Minor | Intermediate | Intermediate | - | Major |
To determine price objectives, it is also possible to use the pivot points. Here is the price position in relation to pivot points:
| Pivot points | S3 | S2 | S1 | PP | R1 | R2 | R3 |
|---|---|---|---|---|---|---|---|
| Standard | 549.23 | 551.25 | 554.14 | 556.16 | 559.05 | 561.07 | 563.96 |
| Camarilla | 555.68 | 556.13 | 556.58 | 557.03 | 557.48 | 557.93 | 558.38 |
| Woodie | 549.67 | 551.47 | 554.58 | 556.38 | 559.49 | 561.29 | 564.40 |
| Fibonacci | 551.25 | 553.13 | 554.28 | 556.16 | 558.04 | 559.19 | 561.07 |
| Pivot points | S3 | S2 | S1 | PP | R1 | R2 | R3 |
|---|---|---|---|---|---|---|---|
| Standard | 538.46 | 544.43 | 552.28 | 558.25 | 566.10 | 572.07 | 579.92 |
| Camarilla | 556.33 | 557.60 | 558.86 | 560.13 | 561.40 | 562.66 | 563.93 |
| Woodie | 539.40 | 544.90 | 553.22 | 558.72 | 567.04 | 572.54 | 580.86 |
| Fibonacci | 544.43 | 549.71 | 552.97 | 558.25 | 563.53 | 566.79 | 572.07 |
| Pivot points | S3 | S2 | S1 | PP | R1 | R2 | R3 |
|---|---|---|---|---|---|---|---|
| Standard | 392.13 | 424.12 | 483.02 | 515.01 | 573.91 | 605.90 | 664.80 |
| Camarilla | 516.93 | 525.26 | 533.59 | 541.92 | 550.25 | 558.58 | 566.92 |
| Woodie | 405.59 | 430.85 | 496.48 | 521.74 | 587.37 | 612.63 | 678.26 |
| Fibonacci | 424.12 | 458.84 | 480.29 | 515.01 | 549.73 | 571.18 | 605.90 |
Numerical data
The following is the status of the technical indicators and moving averages at the time of publication of this technical analysis:
| RSI (14): | 46.97 | |
| MACD (12,26,9): | -0.2700 | |
| Directional Movement: | -6.60 | |
| AROON (14): | 50.00 | |
| DEMA (21): | 556.21 | |
| Parabolic SAR (0,02-0,02-0,2): | 551.12 | |
| Elder Ray (13): | 0.12 | |
| Super Trend (3,10): | 560.94 | |
| Zig ZAG (10): | 555.84 | |
| VORTEX (21): | 1.0400 | |
| Stochastique (14,3,5): | 66.37 | |
| TEMA (21): | 556.16 | |
| Williams %R (14): | -54.02 | |
| Chande Momentum Oscillator (20): | -1.13 | |
| Repulse (5,40,3): | -0.3100 | |
| ROCnROLL: | -1 | |
| TRIX (15,9): | -0.0200 | |
| Courbe Coppock: | 0.01 |
| MA7: | 557.51 | |
| MA20: | 551.28 | |
| MA50: | 504.01 | |
| MA100: | 481.69 | |
| MAexp7: | 556.69 | |
| MAexp20: | 556.69 | |
| MAexp50: | 556.49 | |
| MAexp100: | 550.56 | |
| Price / MA7: | -0.09% | |
| Price / MA20: | +1.04% | |
| Price / MA50: | +10.51% | |
| Price / MA100: | +15.63% | |
| Price / MAexp7: | +0.05% | |
| Price / MAexp20: | +0.05% | |
| Price / MAexp50: | +0.09% | |
| Price / MAexp100: | +1.17% |
News
The latest news and videos published on LOCKHEED MARTIN at the time of the analysis were as follows:
- Lockheed Martin to Acquire Terran Orbital
- Global Super Hercules Fleet Grows with Delivery of First C-130J to New Zealand
- TRIUMPH EXTENDS F-35 SUSTAINMENT AGREEMENT WITH LOCKHEED MARTIN
- Lockheed Martin Reports Second Quarter 2024 Financial Results
- Worldwide C-130J Super Hercules Fleet Soars Past 3 Million Flight Hours
About author
Online


Add a comment
Comments
0 comments on the analysis LOCKHEED MARTIN - 1H