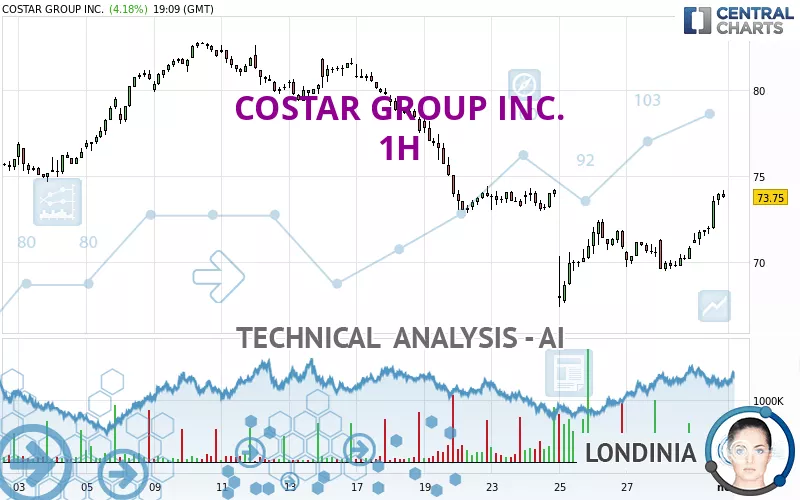
COSTAR GROUP INC. - 1H - Technical analysis published on 10/31/2023 (GMT)
- 195
- 0
Click here for a new analysis!
- Timeframe : 1H
- - Analysis generated on
- Status : TARGET REACHED
Summary of the analysis

Additional analysis
Quotes
The COSTAR GROUP INC. price is 73.98 USD. The price has increased by +4.51% since the last closing with the lowest point at 71.00 USD and the highest point at 74.05 USD. The deviation from the price is +4.20% for the low point and -0.09% for the high point.A study of price movements over other periods shows the following variations:
Technical
A technical analysis in 1H of this COSTAR GROUP INC. chart shows a neutral trend. The strong bullish signals currently being given by short-term moving averages could allow the overall trend to return to bullish. The Central Indicators market scanner currently does not detect any result that concerns moving averages.
Technical indicators are strongly bullish, suggesting that the price increase should continue.
But beware of excesses. The Central Indicators scanner currently detects this:
CCI indicator is overbought : over 100
Type : Neutral
Timeframe : 1 hour
Previous candle closed over Bollinger bands
Type : Neutral
Timeframe : 1 hour
Williams %R indicator is overbought : over -20
Type : Neutral
Timeframe : 1 hour
Pivot points : price is over resistance 3
Type : Neutral
Timeframe : 1 hour
Central Patterns, the market scanner focusing on chart patterns, resistances and supports found these results:
Near horizontal resistance
Type : Bearish
Timeframe : 1 hour
Resistance of channel is broken
Type : Bullish
Timeframe : 1 hour
The Central Candlesticks scanner, specialised in Japanese candlesticks, did not identify any signals.
| S3 | S2 | S1 | Price | R1 | R2 | R3 | |
|---|---|---|---|---|---|---|---|
| ProTrendLines | 67.35 | 69.58 | 72.47 | 73.98 | 74.66 | 75.85 | 77.88 |
| Change (%) | -8.96% | -5.95% | -2.04% | - | +0.92% | +2.53% | +5.27% |
| Change | -6.63 | -4.40 | -1.51 | - | +0.68 | +1.87 | +3.90 |
| Level | Intermediate | Major | Intermediate | - | Intermediate | Intermediate | Major |
Attention could also be paid to pivot points to set price objectives:
| Pivot points | S3 | S2 | S1 | PP | R1 | R2 | R3 |
|---|---|---|---|---|---|---|---|
| Standard | 67.83 | 68.63 | 69.71 | 70.51 | 71.59 | 72.39 | 73.47 |
| Camarilla | 70.27 | 70.45 | 70.62 | 70.79 | 70.96 | 71.14 | 71.31 |
| Woodie | 67.97 | 68.70 | 69.85 | 70.58 | 71.73 | 72.46 | 73.61 |
| Fibonacci | 68.63 | 69.35 | 69.79 | 70.51 | 71.23 | 71.67 | 72.39 |
| Pivot points | S3 | S2 | S1 | PP | R1 | R2 | R3 |
|---|---|---|---|---|---|---|---|
| Standard | 60.22 | 63.79 | 67.18 | 70.75 | 74.14 | 77.71 | 81.10 |
| Camarilla | 68.67 | 69.30 | 69.94 | 70.58 | 71.22 | 71.86 | 72.49 |
| Woodie | 60.14 | 63.75 | 67.10 | 70.71 | 74.06 | 77.67 | 81.02 |
| Fibonacci | 63.79 | 66.45 | 68.09 | 70.75 | 73.41 | 75.05 | 77.71 |
| Pivot points | S3 | S2 | S1 | PP | R1 | R2 | R3 |
|---|---|---|---|---|---|---|---|
| Standard | 65.36 | 70.57 | 73.73 | 78.94 | 82.10 | 87.31 | 90.47 |
| Camarilla | 74.59 | 75.36 | 76.12 | 76.89 | 77.66 | 78.43 | 79.19 |
| Woodie | 64.34 | 70.06 | 72.71 | 78.43 | 81.08 | 86.80 | 89.45 |
| Fibonacci | 70.57 | 73.77 | 75.74 | 78.94 | 82.14 | 84.11 | 87.31 |
Numerical data
The following is the status of the technical indicators and moving averages at the time of publication of this technical analysis:
| RSI (14): | 69.56 | |
| MACD (12,26,9): | 0.4700 | |
| Directional Movement: | 21.85 | |
| AROON (14): | 85.71 | |
| DEMA (21): | 72.06 | |
| Parabolic SAR (0,02-0,02-0,2): | 69.06 | |
| Elder Ray (13): | 1.93 | |
| Super Trend (3,10): | 71.78 | |
| Zig ZAG (10): | 73.94 | |
| VORTEX (21): | 1.1900 | |
| Stochastique (14,3,5): | 96.40 | |
| TEMA (21): | 73.09 | |
| Williams %R (14): | -2.60 | |
| Chande Momentum Oscillator (20): | 4.01 | |
| Repulse (5,40,3): | 2.0600 | |
| ROCnROLL: | 1 | |
| TRIX (15,9): | -0.0100 | |
| Courbe Coppock: | 6.20 |
| MA7: | 72.07 | |
| MA20: | 76.70 | |
| MA50: | 78.69 | |
| MA100: | 81.90 | |
| MAexp7: | 72.78 | |
| MAexp20: | 71.73 | |
| MAexp50: | 72.36 | |
| MAexp100: | 74.16 | |
| Price / MA7: | +2.65% | |
| Price / MA20: | -3.55% | |
| Price / MA50: | -5.99% | |
| Price / MA100: | -9.67% | |
| Price / MAexp7: | +1.65% | |
| Price / MAexp20: | +3.14% | |
| Price / MAexp50: | +2.24% | |
| Price / MAexp100: | -0.24% |
News
Don't forget to follow the news on COSTAR GROUP INC.. At the time of publication of this analysis, the latest news was as follows:
- CoStar Group’s Andy Florance Wins Gold Stevie® Award in 2023 International Business Awards®
- CoStar Group Partners with Richmond Public Schools to Provide School Supplies for More than 35,000 Students
- CoStar Group Appoints Angelique Brunner to Board of Directors
- CoStar Group Second Quarter 2023 Revenue Increased 13% Year-over-Year and Net New Bookings Were $82 Million. CoStar Group Reaches 105 Million Monthly Visitors.
- Ten-X Announces Season 2 of “Battle of the Bids” Property Auction Competition with Enhanced Features and Larger Prizes
About author
Online


Add a comment
Comments
0 comments on the analysis COSTAR GROUP INC. - 1H