COSTAR GROUP INC. - Daily - Technical analysis published on 07/27/2022 (GMT)
- 230
- 0
Click here for a new analysis!
- Timeframe : Daily
- - Analysis generated on
- Status : TARGET REACHED
Summary of the analysis

Additional analysis
Quotes
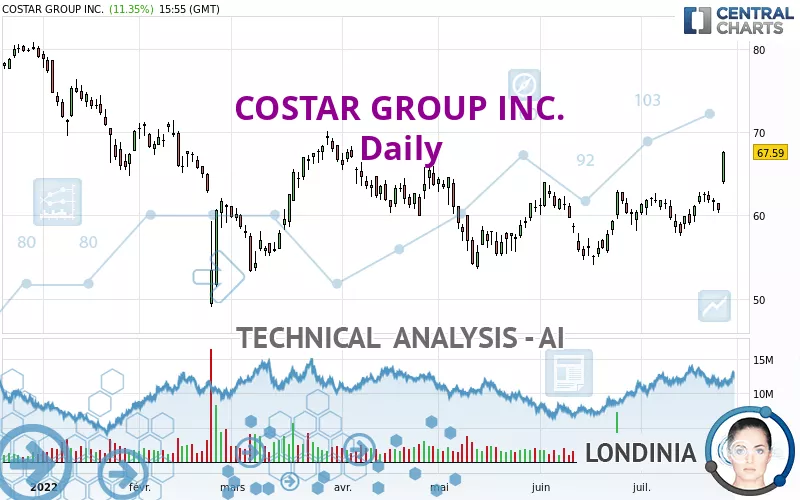
COSTAR GROUP INC. rating 67.58 USD. The price registered an increase of +11.33% on the session with the lowest point at 63.82 USD and the highest point at 67.69 USD. The deviation from the price is +5.89% for the low point and -0.16% for the high point.A bullish gap was detected at the opening by the Central Gaps scanner. There are a lot of buyers and they have the upper hand in the very short term.
Opening Gap UP
Type : Bullish
Timeframe : Openning
A study of price movements over other periods shows the following variations:
New HIGH record (1 month)
Type : Bullish
Timeframe : Weekly
Technical
A technical analysis in Daily of this COSTAR GROUP INC. chart shows a strongly bullish trend. 82.14% of the signals given by moving averages are bullish. This strongly bullish trend is supported by the strong bullish signals given by short-term moving averages. The Central Indicators scanner detects bullish signals on moving averages that could impact this trend:
Moving Average bullish crossovers : AMA20 & AMA50
Type : Bullish
Timeframe : Daily
Bullish price crossover with Moving Average 20
Type : Bullish
Timeframe : Daily
Bullish price crossover with Moving Average 100
Type : Bullish
Timeframe : Daily
Bullish price crossover with adaptative moving average 20
Type : Bullish
Timeframe : Daily
Bullish price crossover with adaptative moving average 50
Type : Bullish
Timeframe : Daily
Bullish price crossover with adaptative moving average 100
Type : Bullish
Timeframe : Daily
The probability of a further increase is high given the direction of the technical indicators.
Caution: the Central Indicators scanner currently detects an excess:
CCI indicator is overbought : over 100
Type : Neutral
Timeframe : Daily
Williams %R indicator is overbought : over -20
Type : Neutral
Timeframe : Daily
Pivot points : price is over resistance 3
Type : Neutral
Timeframe : Daily
Pivot points : price is over resistance 3
Type : Neutral
Timeframe : Weekly
Ichimoku : price is over the cloud
Type : Bullish
Timeframe : Daily
Momentum indicator is back over 0
Type : Bullish
Timeframe : Daily
The Central Patterns scanner, which studies chart patterns, resistances and supports, has identified these signals:
Near horizontal resistance
Type : Bearish
Timeframe : Daily
Resistance of channel is broken
Type : Bullish
Timeframe : Daily
Resistance of triangle is broken
Type : Bullish
Timeframe : Daily
The Central Candlesticks scanner, specialised in Japanese candlesticks, did not identify any signals.
| S3 | S2 | S1 | Price | R1 | R2 | R3 | |
|---|---|---|---|---|---|---|---|
| ProTrendLines | 52.34 | 57.99 | 63.43 | 67.58 | 69.59 | 75.85 | 80.17 |
| Change (%) | -22.55% | -14.19% | -6.14% | - | +2.97% | +12.24% | +18.63% |
| Change | -15.24 | -9.59 | -4.15 | - | +2.01 | +8.27 | +12.59 |
| Level | Major | Intermediate | Major | - | Minor | Major | Intermediate |
Pivot points can also be used to set your price objectives. Here is the price situation in relation to pivot points:
| Pivot points | S3 | S2 | S1 | PP | R1 | R2 | R3 |
|---|---|---|---|---|---|---|---|
| Standard | 58.88 | 59.57 | 60.14 | 60.83 | 61.40 | 62.09 | 62.66 |
| Camarilla | 60.35 | 60.47 | 60.59 | 60.70 | 60.82 | 60.93 | 61.05 |
| Woodie | 58.81 | 59.54 | 60.07 | 60.80 | 61.33 | 62.06 | 62.59 |
| Fibonacci | 59.57 | 60.06 | 60.35 | 60.83 | 61.32 | 61.61 | 62.09 |
| Pivot points | S3 | S2 | S1 | PP | R1 | R2 | R3 |
|---|---|---|---|---|---|---|---|
| Standard | 55.45 | 57.17 | 59.49 | 61.21 | 63.53 | 65.25 | 67.57 |
| Camarilla | 60.70 | 61.07 | 61.44 | 61.81 | 62.18 | 62.55 | 62.92 |
| Woodie | 55.75 | 57.32 | 59.79 | 61.36 | 63.83 | 65.40 | 67.87 |
| Fibonacci | 57.17 | 58.71 | 59.67 | 61.21 | 62.75 | 63.71 | 65.25 |
| Pivot points | S3 | S2 | S1 | PP | R1 | R2 | R3 |
|---|---|---|---|---|---|---|---|
| Standard | 44.97 | 49.50 | 54.95 | 59.48 | 64.93 | 69.46 | 74.91 |
| Camarilla | 57.67 | 58.58 | 59.50 | 60.41 | 61.33 | 62.24 | 63.16 |
| Woodie | 45.44 | 49.73 | 55.42 | 59.71 | 65.40 | 69.69 | 75.38 |
| Fibonacci | 49.50 | 53.31 | 55.66 | 59.48 | 63.29 | 65.64 | 69.46 |
Numerical data
The following are the details of the technical indicators and moving averages that were collected to generate this technical analysis:
| RSI (14): | 68.04 | |
| MACD (12,26,9): | 0.9300 | |
| Directional Movement: | 20.18 | |
| AROON (14): | 64.29 | |
| DEMA (21): | 62.39 | |
| Parabolic SAR (0,02-0,02-0,2): | 57.25 | |
| Elder Ray (13): | 3.86 | |
| Super Trend (3,10): | 59.04 | |
| Zig ZAG (10): | 67.69 | |
| VORTEX (21): | 0.9600 | |
| Stochastique (14,3,5): | 77.56 | |
| TEMA (21): | 63.17 | |
| Williams %R (14): | -1.18 | |
| Chande Momentum Oscillator (20): | 6.13 | |
| Repulse (5,40,3): | 6.4000 | |
| ROCnROLL: | 1 | |
| TRIX (15,9): | 0.1200 | |
| Courbe Coppock: | 3.88 |
| MA7: | 62.51 | |
| MA20: | 61.22 | |
| MA50: | 59.84 | |
| MA100: | 61.00 | |
| MAexp7: | 62.75 | |
| MAexp20: | 61.35 | |
| MAexp50: | 60.81 | |
| MAexp100: | 62.57 | |
| Price / MA7: | +8.11% | |
| Price / MA20: | +10.39% | |
| Price / MA50: | +12.93% | |
| Price / MA100: | +10.79% | |
| Price / MAexp7: | +7.70% | |
| Price / MAexp20: | +10.15% | |
| Price / MAexp50: | +11.13% | |
| Price / MAexp100: | +8.01% |
News
Don't forget to follow the news on COSTAR GROUP INC.. At the time of publication of this analysis, the latest news was as follows:
- CoStar Group Second Quarter 2022 Net New Bookings Grew 66% and Net Income Increased 37% Year-over-Year
- CoStar Group’s Lisa Ruggles Recognized Nationally Among CRE’s Women of Influence and Presented with the 2022 Mentor Award by GlobeSt. Real Estate Forum and GlobeSt.com
- Multifamily Rent Growth Across the Country Cools in Q2
- CoStar Group to Report Financial Results for Second Quarter 2022 on July 26, 2022
- CoStar Group & REBNY Launch Citysnap, New Consumer-facing Home Search Website and App for New York City
About author
Online


Add a comment
Comments
0 comments on the analysis COSTAR GROUP INC. - Daily