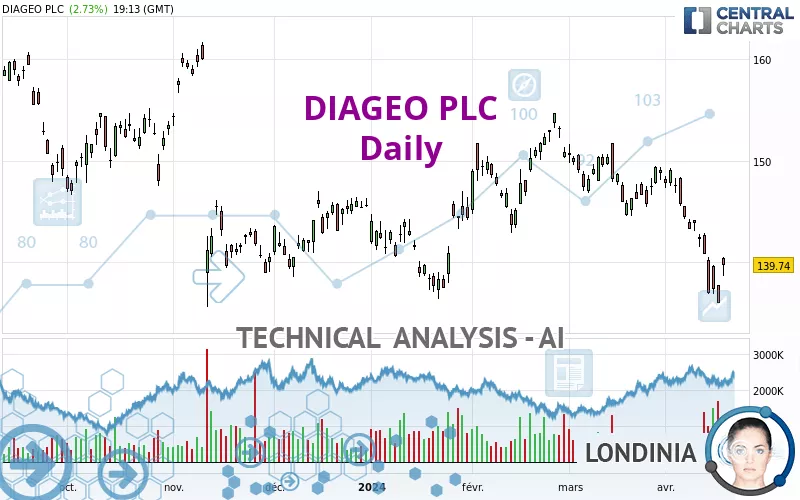
DIAGEO PLC - Daily - Technical analysis published on 04/17/2024 (GMT)
- 173
- 0
Click here for a new analysis!
- Timeframe : Daily
- - Analysis generated on
- Status : TARGET REACHED

Summary of the analysis

Additional analysis
Quotes
The DIAGEO PLC price is 139.74 USD. The price has increased by +2.73% since the last closing with the lowest point at 138.69 USD and the highest point at 140.53 USD. The deviation from the price is +0.76% for the low point and -0.56% for the high point.The Central Gaps scanner detects a bullish gap which is a sign that buyers have taken the lead in the very short term.
Opening Gap UP
Type : Bullish
Timeframe : Openning
Here is a more detailed summary of the historical variations registered by DIAGEO PLC:
Near a new LOW record (1 year)
Type : Bearish
Timeframe : Weekly
Near a new LOW record (1st january)
Type : Bearish
Timeframe : Weekly
Near a new LOW record (1 month)
Type : Bearish
Timeframe : Weekly
The Central Volumes scanner detects abnormal volumes on the asset:
Abnormal volumes
Timeframe : 5 days
Technical
A technical analysis in Daily of this DIAGEO PLC chart shows a sharp bearish trend. The signals given by moving averages are 85.71% bearish. This strong bearish trend is confirmed by the strong signals currently being given by short-term moving averages. There is no crossing of moving average by the price or crossing of moving averages between themselves.
The technical indicators are generally neutral. They do not provide relevant information on the direction of future price movements.
Caution: the Central Indicators scanner currently detects an excess:
Previous candle closed under Bollinger bands
Type : Neutral
Timeframe : Daily
RSI indicator: bullish divergence
Type : Bullish
Timeframe : Daily
Pivot points : price is over resistance 3
Type : Neutral
Timeframe : Daily
An analysis of the price chart with the Central Patterns scanner (detector of chart patterns and resistances and supports) shows several results that can have an impact on the price change:
Near horizontal resistance
Type : Bearish
Timeframe : Daily
Near support of channel
Type : Bullish
Timeframe : Daily
The Central Candlesticks scanner, specialised in Japanese candlesticks, did not identify any signals.
| S3 | S2 | S1 | Price | R1 | R2 | R3 | |
|---|---|---|---|---|---|---|---|
| ProTrendLines | 94.58 | 118.49 | 138.86 | 139.74 | 145.58 | 153.04 | 157.97 |
| Change (%) | -32.32% | -15.21% | -0.63% | - | +4.18% | +9.52% | +13.05% |
| Change | -45.16 | -21.25 | -0.88 | - | +5.84 | +13.30 | +18.23 |
| Level | Major | Minor | Major | - | Major | Intermediate | Major |
To determine price objectives, it is also possible to use the pivot points. Here is the price position in relation to pivot points:
| Pivot points | S3 | S2 | S1 | PP | R1 | R2 | R3 |
|---|---|---|---|---|---|---|---|
| Standard | 133.65 | 134.83 | 135.43 | 136.61 | 137.21 | 138.39 | 138.99 |
| Camarilla | 135.54 | 135.70 | 135.87 | 136.03 | 136.19 | 136.36 | 136.52 |
| Woodie | 133.36 | 134.69 | 135.14 | 136.47 | 136.92 | 138.25 | 138.70 |
| Fibonacci | 134.83 | 135.51 | 135.93 | 136.61 | 137.29 | 137.71 | 138.39 |
| Pivot points | S3 | S2 | S1 | PP | R1 | R2 | R3 |
|---|---|---|---|---|---|---|---|
| Standard | 127.08 | 131.98 | 134.48 | 139.38 | 141.88 | 146.78 | 149.28 |
| Camarilla | 134.96 | 135.63 | 136.31 | 136.99 | 137.67 | 138.35 | 139.03 |
| Woodie | 125.89 | 131.38 | 133.29 | 138.78 | 140.69 | 146.18 | 148.09 |
| Fibonacci | 131.98 | 134.80 | 136.55 | 139.38 | 142.20 | 143.95 | 146.78 |
| Pivot points | S3 | S2 | S1 | PP | R1 | R2 | R3 |
|---|---|---|---|---|---|---|---|
| Standard | 137.73 | 141.14 | 144.94 | 148.35 | 152.15 | 155.56 | 159.36 |
| Camarilla | 146.76 | 147.42 | 148.08 | 148.74 | 149.40 | 150.06 | 150.72 |
| Woodie | 137.93 | 141.24 | 145.14 | 148.45 | 152.35 | 155.66 | 159.56 |
| Fibonacci | 141.14 | 143.89 | 145.60 | 148.35 | 151.10 | 152.81 | 155.56 |
Numerical data
The following is the status of the technical indicators and moving averages at the time of publication of this technical analysis:
| RSI (14): | 39.47 | |
| MACD (12,26,9): | -2.5000 | |
| Directional Movement: | -16.17 | |
| AROON (14): | -92.86 | |
| DEMA (21): | 140.30 | |
| Parabolic SAR (0,02-0,02-0,2): | 143.77 | |
| Elder Ray (13): | -2.03 | |
| Super Trend (3,10): | 143.24 | |
| Zig ZAG (10): | 139.86 | |
| VORTEX (21): | 0.7000 | |
| Stochastique (14,3,5): | 11.14 | |
| TEMA (21): | 138.06 | |
| Williams %R (14): | -70.86 | |
| Chande Momentum Oscillator (20): | -7.92 | |
| Repulse (5,40,3): | -3.4000 | |
| ROCnROLL: | 2 | |
| TRIX (15,9): | -0.1600 | |
| Courbe Coppock: | 10.69 |
| MA7: | 139.61 | |
| MA20: | 144.30 | |
| MA50: | 146.69 | |
| MA100: | 144.02 | |
| MAexp7: | 139.70 | |
| MAexp20: | 143.10 | |
| MAexp50: | 145.01 | |
| MAexp100: | 146.48 | |
| Price / MA7: | +0.09% | |
| Price / MA20: | -3.16% | |
| Price / MA50: | -4.74% | |
| Price / MA100: | -2.97% | |
| Price / MAexp7: | +0.03% | |
| Price / MAexp20: | -2.35% | |
| Price / MAexp50: | -3.63% | |
| Price / MAexp100: | -4.60% |
News
Don't forget to follow the news on DIAGEO PLC. At the time of publication of this analysis, the latest news was as follows:
About author
Online


Add a comment
Comments
0 comments on the analysis DIAGEO PLC - Daily