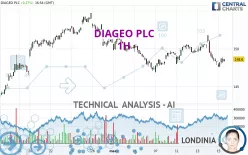
DIAGEO PLC - 1H - Technical analysis published on 03/15/2024 (GMT)
- 171
- 0
Click here for a new analysis!
- Timeframe : 1H
- - Analysis generated on
- Status : TARGET REACHED

Summary of the analysis

Additional analysis
Quotes
DIAGEO PLC rating 148.15 USD. The price is lower by -0.03% since the last closing with the lowest point at 147.61 USD and the highest point at 148.83 USD. The deviation from the price is +0.37% for the low point and -0.46% for the high point.The Central Gaps scanner detects a bearish opening. A small advantage for sellers in the very short term.
Bearish opening
Type : Bearish
Timeframe : Openning
A study of price movements over other periods shows the following variations:
Near a new HIGH record (1st january)
Type : Bullish
Timeframe : Weekly
Near a new HIGH record (1 month)
Type : Bullish
Timeframe : Weekly
Technical
A technical analysis in 1H of this DIAGEO PLC chart shows a sharp bearish trend. 85.71% of the signals given by moving averages are bearish. The overall trend is supported by the strong bearish signals from short-term moving averages. The Central Indicators scanner does not detect any result on moving averages that would impact this trend.
An assessment of technical indicators does not currently provide any relevant information on the direction of future price movements.
Caution: the Central Indicators scanner currently detects an excess:
Williams %R indicator is oversold : under -80
Type : Neutral
Timeframe : 1 hour
An analysis of the price chart with the Central Patterns scanner (detector of chart patterns and resistances and supports) shows several results that can have an impact on the price change:
Near horizontal resistance
Type : Bearish
Timeframe : 1 hour
Near support of channel
Type : Bullish
Timeframe : 1 hour
Near support of triangle
Type : Bullish
Timeframe : 1 hour
The presence of a bearish pattern in Japanese candlesticks detected by Central Candlesticks that could cause a correction in the very short term was also detected:
Bearish harami
Type : Bearish
Timeframe : 1 hour
| S3 | S2 | S1 | Price | R1 | R2 | R3 | |
|---|---|---|---|---|---|---|---|
| ProTrendLines | 143.82 | 145.43 | 146.84 | 148.15 | 148.55 | 150.61 | 151.60 |
| Change (%) | -2.92% | -1.84% | -0.88% | - | +0.27% | +1.66% | +2.33% |
| Change | -4.33 | -2.72 | -1.31 | - | +0.40 | +2.46 | +3.45 |
| Level | Minor | Minor | Intermediate | - | Minor | Intermediate | Minor |
Attention could also be paid to pivot points to set price objectives:
| Pivot points | S3 | S2 | S1 | PP | R1 | R2 | R3 |
|---|---|---|---|---|---|---|---|
| Standard | 142.89 | 145.37 | 146.79 | 149.27 | 150.69 | 153.17 | 154.59 |
| Camarilla | 147.13 | 147.49 | 147.84 | 148.20 | 148.56 | 148.92 | 149.27 |
| Woodie | 142.35 | 145.11 | 146.25 | 149.01 | 150.15 | 152.91 | 154.05 |
| Fibonacci | 145.37 | 146.86 | 147.78 | 149.27 | 150.76 | 151.68 | 153.17 |
| Pivot points | S3 | S2 | S1 | PP | R1 | R2 | R3 |
|---|---|---|---|---|---|---|---|
| Standard | 143.35 | 145.09 | 147.13 | 148.87 | 150.91 | 152.65 | 154.69 |
| Camarilla | 148.12 | 148.47 | 148.81 | 149.16 | 149.51 | 149.85 | 150.20 |
| Woodie | 143.49 | 145.17 | 147.27 | 148.95 | 151.05 | 152.73 | 154.83 |
| Fibonacci | 145.09 | 146.54 | 147.43 | 148.87 | 150.32 | 151.21 | 152.65 |
| Pivot points | S3 | S2 | S1 | PP | R1 | R2 | R3 |
|---|---|---|---|---|---|---|---|
| Standard | 132.12 | 136.77 | 143.78 | 148.43 | 155.44 | 160.09 | 167.10 |
| Camarilla | 147.59 | 148.66 | 149.73 | 150.80 | 151.87 | 152.94 | 154.01 |
| Woodie | 133.31 | 137.36 | 144.97 | 149.02 | 156.63 | 160.68 | 168.29 |
| Fibonacci | 136.77 | 141.22 | 143.97 | 148.43 | 152.88 | 155.63 | 160.09 |
Numerical data
The following is the status of technical indicators and moving averages registered at the time this technical analysis was created:
| RSI (14): | 40.70 | |
| MACD (12,26,9): | -0.3800 | |
| Directional Movement: | -5.60 | |
| AROON (14): | -57.14 | |
| DEMA (21): | 148.62 | |
| Parabolic SAR (0,02-0,02-0,2): | 149.60 | |
| Elder Ray (13): | -0.24 | |
| Super Trend (3,10): | 149.74 | |
| Zig ZAG (10): | 148.27 | |
| VORTEX (21): | 0.8600 | |
| Stochastique (14,3,5): | 18.67 | |
| TEMA (21): | 148.22 | |
| Williams %R (14): | -85.18 | |
| Chande Momentum Oscillator (20): | -2.32 | |
| Repulse (5,40,3): | -0.0900 | |
| ROCnROLL: | 2 | |
| TRIX (15,9): | -0.0200 | |
| Courbe Coppock: | 2.28 |
| MA7: | 149.17 | |
| MA20: | 149.62 | |
| MA50: | 145.19 | |
| MA100: | 145.01 | |
| MAexp7: | 148.47 | |
| MAexp20: | 149.02 | |
| MAexp50: | 149.31 | |
| MAexp100: | 149.17 | |
| Price / MA7: | -0.68% | |
| Price / MA20: | -0.98% | |
| Price / MA50: | +2.04% | |
| Price / MA100: | +2.17% | |
| Price / MAexp7: | -0.22% | |
| Price / MAexp20: | -0.58% | |
| Price / MAexp50: | -0.78% | |
| Price / MAexp100: | -0.68% |
News
Don't forget to follow the news on DIAGEO PLC. At the time of publication of this analysis, the latest news was as follows:
About author
Online


Add a comment
Comments
0 comments on the analysis DIAGEO PLC - 1H