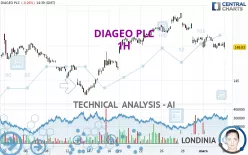
DIAGEO PLC - 1H - Technical analysis published on 03/05/2024 (GMT)
- 140
- 0
Click here for a new analysis!
- Timeframe : 1H
- - Analysis generated on
- Status : TARGET REACHED

Summary of the analysis

Additional analysis
Quotes
The DIAGEO PLC rating is 150.20 USD. The price registered a decrease of -0.01% on the session and was traded between 150.09 USD and 150.52 USD over the period. The price is currently at +0.07% from its lowest and -0.21% from its highest.A bullish opening was detected by the Central Gaps scanner. Buyers are trying to impose a bullish momentum in the very short term.
Bullish opening
Type : Bullish
Timeframe : Openning
A study of price movements over other periods shows the following variations:
Near a new HIGH record (1st january)
Type : Bullish
Timeframe : Weekly
Near a new HIGH record (1 month)
Type : Bullish
Timeframe : Weekly
Technical
Technical analysis of DIAGEO PLC in 1H shows an overall slightly bullish trend. 53.57% of the signals given by moving averages are bullish. Caution: the strong bearish signals currently given by short-term moving averages indicate that a trend reversal may be taking place. The Central Indicators scanner does not detect any result on moving averages that would impact this trend.
An assessment of technical indicators does not currently provide any relevant information to suggest whether the signal given by the technical indicators is more bullish or bearish.
Central Indicators, the detector scanner for these technical indicators recently detected a signal:
Momentum indicator is back under 0
Type : Bearish
Timeframe : 1 hour
The Central Patterns scanner, which studies chart patterns, resistances and supports, has identified these signals:
Near horizontal resistance
Type : Bearish
Timeframe : 1 hour
Near support of channel
Type : Bullish
Timeframe : 1 hour
Near support of triangle
Type : Bullish
Timeframe : 1 hour
The Central Candlesticks scanner which studies Japanese candlesticks did not detect anything.
| S3 | S2 | S1 | Price | R1 | R2 | R3 | |
|---|---|---|---|---|---|---|---|
| ProTrendLines | 144.94 | 148.33 | 150.16 | 150.20 | 151.59 | 153.01 | 157.97 |
| Change (%) | -3.50% | -1.25% | -0.03% | - | +0.93% | +1.87% | +5.17% |
| Change | -5.26 | -1.87 | -0.04 | - | +1.39 | +2.81 | +7.77 |
| Level | Minor | Intermediate | Major | - | Intermediate | Intermediate | Major |
Pivot points can also be used to set your price objectives. Here is the price situation in relation to pivot points:
| Pivot points | S3 | S2 | S1 | PP | R1 | R2 | R3 |
|---|---|---|---|---|---|---|---|
| Standard | 148.77 | 149.16 | 149.69 | 150.08 | 150.61 | 151.00 | 151.53 |
| Camarilla | 149.97 | 150.05 | 150.14 | 150.22 | 150.30 | 150.39 | 150.47 |
| Woodie | 148.84 | 149.20 | 149.76 | 150.12 | 150.68 | 151.04 | 151.60 |
| Fibonacci | 149.16 | 149.51 | 149.73 | 150.08 | 150.43 | 150.65 | 151.00 |
| Pivot points | S3 | S2 | S1 | PP | R1 | R2 | R3 |
|---|---|---|---|---|---|---|---|
| Standard | 145.95 | 147.84 | 149.28 | 151.17 | 152.61 | 154.50 | 155.94 |
| Camarilla | 149.79 | 150.10 | 150.41 | 150.71 | 151.02 | 151.32 | 151.63 |
| Woodie | 145.72 | 147.73 | 149.05 | 151.06 | 152.38 | 154.39 | 155.71 |
| Fibonacci | 147.84 | 149.12 | 149.90 | 151.17 | 152.45 | 153.23 | 154.50 |
| Pivot points | S3 | S2 | S1 | PP | R1 | R2 | R3 |
|---|---|---|---|---|---|---|---|
| Standard | 132.12 | 136.77 | 143.78 | 148.43 | 155.44 | 160.09 | 167.10 |
| Camarilla | 147.59 | 148.66 | 149.73 | 150.80 | 151.87 | 152.94 | 154.01 |
| Woodie | 133.31 | 137.36 | 144.97 | 149.02 | 156.63 | 160.68 | 168.29 |
| Fibonacci | 136.77 | 141.22 | 143.97 | 148.43 | 152.88 | 155.63 | 160.09 |
Numerical data
The following is the status of technical indicators and moving averages registered at the time this technical analysis was created:
| RSI (14): | 46.07 | |
| MACD (12,26,9): | -0.2100 | |
| Directional Movement: | -5.70 | |
| AROON (14): | -42.86 | |
| DEMA (21): | 150.26 | |
| Parabolic SAR (0,02-0,02-0,2): | 150.97 | |
| Elder Ray (13): | -0.06 | |
| Super Trend (3,10): | 151.61 | |
| Zig ZAG (10): | 150.32 | |
| VORTEX (21): | 1.0000 | |
| Stochastique (14,3,5): | 33.01 | |
| TEMA (21): | 149.98 | |
| Williams %R (14): | -58.33 | |
| Chande Momentum Oscillator (20): | -0.85 | |
| Repulse (5,40,3): | -0.1700 | |
| ROCnROLL: | -1 | |
| TRIX (15,9): | -0.0200 | |
| Courbe Coppock: | 0.84 |
| MA7: | 151.10 | |
| MA20: | 148.28 | |
| MA50: | 144.34 | |
| MA100: | 145.18 | |
| MAexp7: | 150.23 | |
| MAexp20: | 150.51 | |
| MAexp50: | 150.33 | |
| MAexp100: | 149.10 | |
| Price / MA7: | -0.60% | |
| Price / MA20: | +1.29% | |
| Price / MA50: | +4.06% | |
| Price / MA100: | +3.46% | |
| Price / MAexp7: | -0.02% | |
| Price / MAexp20: | -0.21% | |
| Price / MAexp50: | -0.09% | |
| Price / MAexp100: | +0.74% |
News
Don't forget to follow the news on DIAGEO PLC. At the time of publication of this analysis, the latest news was as follows:
About author
Online


Add a comment
Comments
0 comments on the analysis DIAGEO PLC - 1H