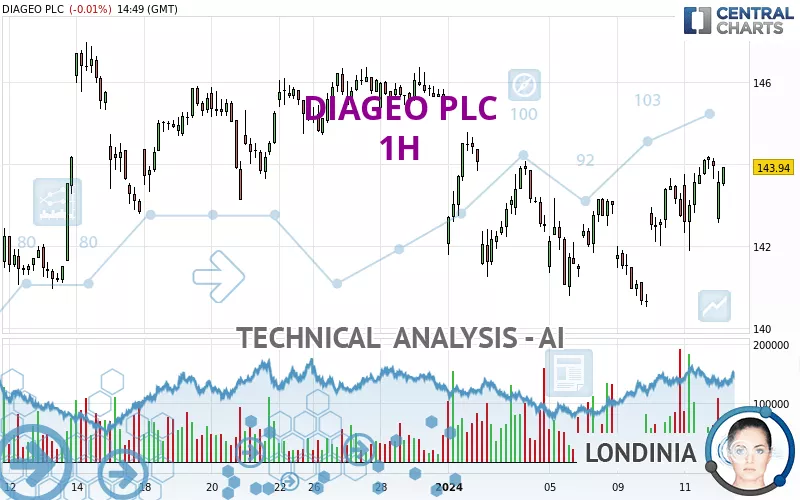
DIAGEO PLC - 1H - Technical analysis published on 01/12/2024 (GMT)
- 153
- 0
Click here for a new analysis!
- Timeframe : 1H
- - Analysis generated on
- Status : INVALID
Summary of the analysis

Additional analysis
Quotes
The DIAGEO PLC price is 143.64 USD. The price is lower by -0.22% since the last closing with the lowest point at 142.56 USD and the highest point at 143.82 USD. The deviation from the price is +0.76% for the low point and -0.13% for the high point.The Central Gaps scanner detects a bearish opening marking the presence of sellers ahead of buyers at the opening but not sufficiently marked to allow the price to register a quotation gap.
Bearish opening
Type : Bearish
Timeframe : Openning
Here is a more detailed summary of the historical variations registered by DIAGEO PLC:
Near a new LOW record (1 year)
Type : Bearish
Timeframe : Weekly
New HIGH record (1st january)
Type : Bullish
Timeframe : Weekly
Near a new HIGH record (1 month)
Type : Bullish
Timeframe : Weekly
The Central Volumes scanner notes the presence of abnormal volumes:
Abnormal volumes
Timeframe : 50 days
Technical
Technical analysis of DIAGEO PLC in 1H shows a neutral overall trend. This indecision could turn into a bullish trend due to the strong bullish signals currently being given by short-term moving averages. An assessment of moving averages reveals several bearish signals that could impact this trend:
Bearish price crossover with Moving Average 100
Type : Bearish
Timeframe : 1 hour
Bearish price crossover with adaptative moving average 100
Type : Bearish
Timeframe : 1 hour
Technical indicators are slightly bullish. There is therefore considerable uncertainty about the continuation of the increase.
Central Indicators, the scanner specialised in technical indicators, has identified these signals:
Pivot points : price is over resistance 1
Type : Neutral
Timeframe : Weekly
Parabolic SAR indicator bearish reversal
Type : Bearish
Timeframe : 1 hour
An analysis of the price chart with the Central Patterns scanner (detector of chart patterns and resistances and supports) shows a result that can have an impact on the price change:
Near resistance of channel
Type : Bearish
Timeframe : 1 hour
No result was found by the Central Candlesticks scanner on Japanese candlesticks.
| S3 | S2 | S1 | Price | R1 | R2 | R3 | |
|---|---|---|---|---|---|---|---|
| ProTrendLines | 140.99 | 141.83 | 143.15 | 143.64 | 144.08 | 144.74 | 145.38 |
| Change (%) | -1.84% | -1.26% | -0.34% | - | +0.31% | +0.77% | +1.21% |
| Change | -2.65 | -1.81 | -0.49 | - | +0.44 | +1.10 | +1.74 |
| Level | Intermediate | Minor | Intermediate | - | Minor | Minor | Minor |
To determine price objectives, it is also possible to use the pivot points. Here is the price position in relation to pivot points:
| Pivot points | S3 | S2 | S1 | PP | R1 | R2 | R3 |
|---|---|---|---|---|---|---|---|
| Standard | 140.15 | 141.02 | 142.48 | 143.35 | 144.81 | 145.68 | 147.14 |
| Camarilla | 143.31 | 143.52 | 143.74 | 143.95 | 144.16 | 144.38 | 144.59 |
| Woodie | 140.46 | 141.17 | 142.79 | 143.50 | 145.12 | 145.83 | 147.45 |
| Fibonacci | 141.02 | 141.91 | 142.46 | 143.35 | 144.24 | 144.79 | 145.68 |
| Pivot points | S3 | S2 | S1 | PP | R1 | R2 | R3 |
|---|---|---|---|---|---|---|---|
| Standard | 135.94 | 138.36 | 139.94 | 142.36 | 143.94 | 146.36 | 147.94 |
| Camarilla | 140.41 | 140.78 | 141.14 | 141.51 | 141.88 | 142.24 | 142.61 |
| Woodie | 135.51 | 138.15 | 139.51 | 142.15 | 143.51 | 146.15 | 147.51 |
| Fibonacci | 138.36 | 139.89 | 140.84 | 142.36 | 143.89 | 144.84 | 146.36 |
| Pivot points | S3 | S2 | S1 | PP | R1 | R2 | R3 |
|---|---|---|---|---|---|---|---|
| Standard | 132.12 | 135.36 | 140.51 | 143.75 | 148.90 | 152.14 | 157.29 |
| Camarilla | 143.35 | 144.12 | 144.89 | 145.66 | 146.43 | 147.20 | 147.97 |
| Woodie | 133.08 | 135.84 | 141.47 | 144.23 | 149.86 | 152.62 | 158.25 |
| Fibonacci | 135.36 | 138.57 | 140.55 | 143.75 | 146.96 | 148.94 | 152.14 |
Numerical data
The following are the details of the technical indicators and moving averages that were collected to generate this technical analysis:
| RSI (14): | 51.48 | |
| MACD (12,26,9): | 0.3600 | |
| Directional Movement: | -4.25 | |
| AROON (14): | 28.57 | |
| DEMA (21): | 143.43 | |
| Parabolic SAR (0,02-0,02-0,2): | 144.22 | |
| Elder Ray (13): | -0.39 | |
| Super Trend (3,10): | 141.93 | |
| Zig ZAG (10): | 142.97 | |
| VORTEX (21): | 0.9600 | |
| Stochastique (14,3,5): | 78.13 | |
| TEMA (21): | 143.88 | |
| Williams %R (14): | -52.03 | |
| Chande Momentum Oscillator (20): | 0.46 | |
| Repulse (5,40,3): | 0.5900 | |
| ROCnROLL: | -1 | |
| TRIX (15,9): | 0.0200 | |
| Courbe Coppock: | 2.59 |
| MA7: | 142.49 | |
| MA20: | 144.01 | |
| MA50: | 144.98 | |
| MA100: | 150.63 | |
| MAexp7: | 143.54 | |
| MAexp20: | 143.06 | |
| MAexp50: | 143.02 | |
| MAexp100: | 143.30 | |
| Price / MA7: | +0.81% | |
| Price / MA20: | -0.26% | |
| Price / MA50: | -0.92% | |
| Price / MA100: | -4.64% | |
| Price / MAexp7: | +0.07% | |
| Price / MAexp20: | +0.41% | |
| Price / MAexp50: | +0.43% | |
| Price / MAexp100: | +0.24% |
News
Don't forget to follow the news on DIAGEO PLC. At the time of publication of this analysis, the latest news was as follows:
About author
Online


Add a comment
Comments
0 comments on the analysis DIAGEO PLC - 1H