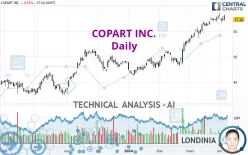
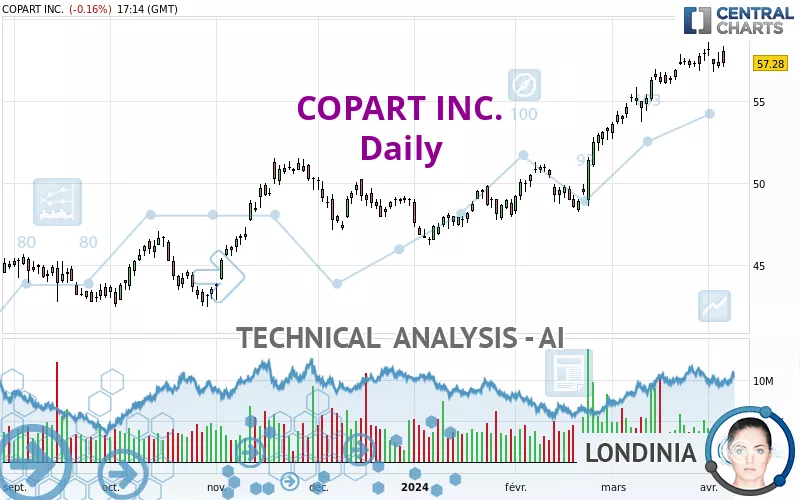
COPART INC. - Daily - Technical analysis published on 04/04/2024 (GMT)
- 203
- 0
Click here for a new analysis!
- Timeframe : Daily
- - Analysis generated on
- Status : INVALID
Summary of the analysis

Additional analysis
Quotes
The COPART INC. price is 57.28 USD. On the day, this instrument lost -0.16% and was traded between 57.04 USD and 58.35 USD over the period. The price is currently at +0.42% from its lowest and -1.83% from its highest.A bullish gap was detected at the opening by the Central Gaps scanner. There are a lot of buyers and they have the upper hand in the very short term.
Opening Gap UP
Type : Bullish
Timeframe : Openning
A study of price movements over other periods shows the following variations:
New HIGH record (5 years)
Type : Bullish
Timeframe : Weekly
Near a new HIGH record (1 year)
Type : Bullish
Timeframe : Weekly
Near a new HIGH record (1st january)
Type : Bullish
Timeframe : Weekly
Near a new HIGH record (1 month)
Type : Bullish
Timeframe : Weekly
Technical
A technical analysis in Daily of this COPART INC. chart shows a strongly bullish trend. 92.86% of the signals given by moving averages are bullish. This strongly bullish trend is supported by the strong bullish signals given by short-term moving averages. There is no crossing of moving average by the price or crossing of moving averages between themselves.
An assessment of technical indicators does not currently provide any relevant information to suggest whether the signal given by the technical indicators is more bullish or bearish.
Central Indicators, the detector scanner for these technical indicators has recently detected several signals:
Price is back under the pivot point
Type : Bearish
Timeframe : Daily
Price is back under the pivot point
Type : Bearish
Timeframe : Weekly
Williams %R indicator is back under -50
Type : Bearish
Timeframe : Daily
Central Patterns, the market scanner focusing on chart patterns, resistances and supports found this result:
Near horizontal resistance
Type : Bearish
Timeframe : Daily
The Central Candlesticks scanner which studies Japanese candlesticks did not detect anything.
| S3 | S2 | S1 | Price | R1 | |
|---|---|---|---|---|---|
| ProTrendLines | 46.66 | 48.52 | 51.20 | 57.28 | 57.41 |
| Change (%) | -18.54% | -15.29% | -10.61% | - | +0.23% |
| Change | -10.62 | -8.76 | -6.08 | - | +0.13 |
| Level | Major | Minor | Minor | - | Major |
To determine price objectives, it is also possible to use the pivot points. Here is the price position in relation to pivot points:
| Pivot points | S3 | S2 | S1 | PP | R1 | R2 | R3 |
|---|---|---|---|---|---|---|---|
| Standard | 55.99 | 56.50 | 56.94 | 57.45 | 57.89 | 58.40 | 58.84 |
| Camarilla | 57.11 | 57.20 | 57.28 | 57.37 | 57.46 | 57.54 | 57.63 |
| Woodie | 55.95 | 56.48 | 56.90 | 57.43 | 57.85 | 58.38 | 58.80 |
| Fibonacci | 56.50 | 56.87 | 57.09 | 57.45 | 57.82 | 58.04 | 58.40 |
| Pivot points | S3 | S2 | S1 | PP | R1 | R2 | R3 |
|---|---|---|---|---|---|---|---|
| Standard | 55.76 | 56.29 | 57.10 | 57.63 | 58.44 | 58.97 | 59.78 |
| Camarilla | 57.55 | 57.67 | 57.80 | 57.92 | 58.04 | 58.17 | 58.29 |
| Woodie | 55.91 | 56.36 | 57.25 | 57.70 | 58.59 | 59.04 | 59.93 |
| Fibonacci | 56.29 | 56.80 | 57.12 | 57.63 | 58.14 | 58.46 | 58.97 |
| Pivot points | S3 | S2 | S1 | PP | R1 | R2 | R3 |
|---|---|---|---|---|---|---|---|
| Standard | 48.86 | 50.77 | 54.34 | 56.25 | 59.82 | 61.73 | 65.30 |
| Camarilla | 56.41 | 56.92 | 57.42 | 57.92 | 58.42 | 58.93 | 59.43 |
| Woodie | 49.70 | 51.19 | 55.18 | 56.67 | 60.66 | 62.15 | 66.14 |
| Fibonacci | 50.77 | 52.86 | 54.15 | 56.25 | 58.34 | 59.63 | 61.73 |
Numerical data
The following is the status of the technical indicators and moving averages at the time of publication of this technical analysis:
| RSI (14): | 66.87 | |
| MACD (12,26,9): | 1.3100 | |
| Directional Movement: | 21.47 | |
| AROON (14): | 71.43 | |
| DEMA (21): | 58.18 | |
| Parabolic SAR (0,02-0,02-0,2): | 58.54 | |
| Elder Ray (13): | 0.73 | |
| Super Trend (3,10): | 55.68 | |
| Zig ZAG (10): | 57.24 | |
| VORTEX (21): | 1.1300 | |
| Stochastique (14,3,5): | 54.80 | |
| TEMA (21): | 58.18 | |
| Williams %R (14): | -52.33 | |
| Chande Momentum Oscillator (20): | 1.15 | |
| Repulse (5,40,3): | -2.2100 | |
| ROCnROLL: | 1 | |
| TRIX (15,9): | 0.4100 | |
| Courbe Coppock: | 6.73 |
| MA7: | 57.47 | |
| MA20: | 56.60 | |
| MA50: | 52.99 | |
| MA100: | 50.90 | |
| MAexp7: | 57.35 | |
| MAexp20: | 56.32 | |
| MAexp50: | 53.82 | |
| MAexp100: | 51.32 | |
| Price / MA7: | -0.33% | |
| Price / MA20: | +1.20% | |
| Price / MA50: | +8.10% | |
| Price / MA100: | +12.53% | |
| Price / MAexp7: | -0.12% | |
| Price / MAexp20: | +1.70% | |
| Price / MAexp50: | +6.43% | |
| Price / MAexp100: | +11.61% |
News
The latest news and videos published on COPART INC. at the time of the analysis were as follows:
- Copart Appoints Jeff Liaw as CEO and Director and Jay Adair as Executive Chairman
- Copart, Inc. Announces Senior Leadership Appointments
- Copart Announces Investment in Heavy Equipment Auction Company Purple Wave
- Hi Marley and Copart Announce Strategic Partnership to Support Auto Insurers
- Copart, Inc. Announces a Two-for-One Stock Split
About author
Online


Add a comment
Comments
0 comments on the analysis COPART INC. - Daily