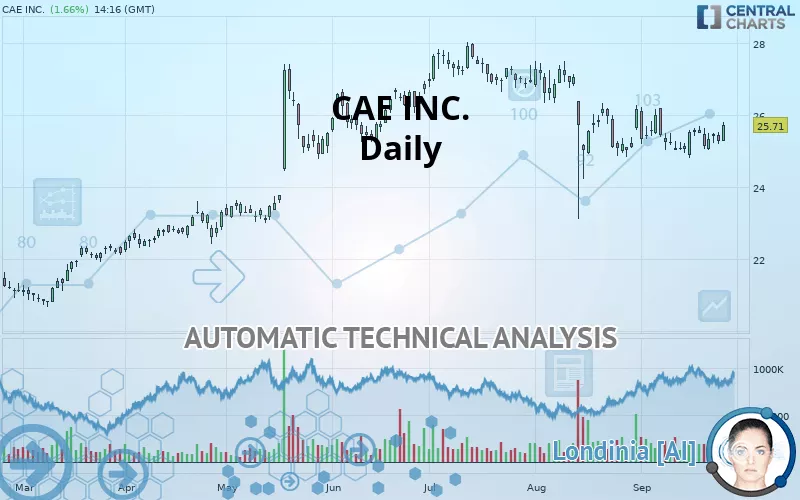
CAE INC. - Daily - Technical analysis published on 09/26/2019 (GMT)
- 276
- 0
- Who voted?
Click here for a new analysis!
- Timeframe : Daily
- - Analysis generated on
- Status : INVALID
Summary of the analysis

Additional analysis
Quotes
The CAE INC. rating is 25.71 USD. On the day, this instrument gained +1.66% with the lowest point at 25.29 USD and the highest point at 25.81 USD. The deviation from the price is +1.66% for the low point and -0.39% for the high point.A study of price movements over other periods shows the following variations:
Technical
Technical analysis of CAE INC. in Daily shows an overall slightly bullish trend. 57.14% of the signals given by moving averages are bullish. The overall trend remains fragile, as do the slightly bullish signals given by short-term moving averages. The Central Indicators scanner does not detect any result on moving averages that would impact this trend.
In fact, only 8 technical indicators out of 18 studied are currently positioned bullish. But beware of excesses. The Central Indicators scanner currently detects this:
MACD indicator: bearish divergence
Type : Bearish
Timeframe : Daily
Williams %R indicator is overbought : over -20
Type : Neutral
Timeframe : Daily
Pivot points : price is over resistance 1
Type : Neutral
Timeframe : Weekly
Pivot points : price is over resistance 2
Type : Neutral
Timeframe : Daily
Ichimoku : price is under the cloud
Type : Bearish
Timeframe : Daily
Price is back under the pivot point
Type : Bearish
Timeframe : Daily
An analysis of the price chart with the Central Patterns scanner (detector of chart patterns and resistances and supports) shows a result that can have an impact on the price change:
Resistance of triangle is broken
Type : Bullish
Timeframe : Daily
No result was found by the Central Candlesticks scanner on Japanese candlesticks.
| S3 | S2 | S1 | Price | R1 | |
|---|---|---|---|---|---|
| ProTrendLines | 21.47 | 23.13 | 24.37 | 25.71 | 27.91 |
| Change (%) | -16.49% | -10.04% | -5.21% | - | +8.56% |
| Change | -4.24 | -2.58 | -1.34 | - | +2.20 |
| Level | Major | Minor | Major | - | Major |
To determine price objectives, it is also possible to use the pivot points. Here is the price position in relation to pivot points:
| Pivot points | S3 | S2 | S1 | PP | R1 | R2 | R3 |
|---|---|---|---|---|---|---|---|
| Standard | 24.79 | 24.98 | 25.14 | 25.33 | 25.49 | 25.68 | 25.84 |
| Camarilla | 25.19 | 25.23 | 25.26 | 25.29 | 25.32 | 25.35 | 25.39 |
| Woodie | 24.77 | 24.97 | 25.12 | 25.32 | 25.47 | 25.67 | 25.82 |
| Fibonacci | 24.98 | 25.12 | 25.20 | 25.33 | 25.47 | 25.55 | 25.68 |
| Pivot points | S3 | S2 | S1 | PP | R1 | R2 | R3 |
|---|---|---|---|---|---|---|---|
| Standard | 23.84 | 24.32 | 24.73 | 25.21 | 25.62 | 26.10 | 26.51 |
| Camarilla | 24.90 | 24.98 | 25.06 | 25.14 | 25.22 | 25.30 | 25.39 |
| Woodie | 23.81 | 24.30 | 24.70 | 25.19 | 25.59 | 26.08 | 26.48 |
| Fibonacci | 24.32 | 24.66 | 24.87 | 25.21 | 25.55 | 25.76 | 26.10 |
| Pivot points | S3 | S2 | S1 | PP | R1 | R2 | R3 |
|---|---|---|---|---|---|---|---|
| Standard | 19.24 | 21.13 | 23.61 | 25.50 | 27.98 | 29.87 | 32.34 |
| Camarilla | 24.88 | 25.28 | 25.68 | 26.08 | 26.48 | 26.88 | 27.28 |
| Woodie | 19.52 | 21.28 | 23.89 | 25.65 | 28.26 | 30.02 | 32.63 |
| Fibonacci | 21.13 | 22.80 | 23.84 | 25.50 | 27.17 | 28.20 | 29.87 |
Numerical data
The following is the status of the technical indicators and moving averages at the time of publication of this technical analysis:
| RSI (14): | 50.97 | |
| MACD (12,26,9): | -0.1200 | |
| Directional Movement: | -4.78 | |
| AROON (14): | -42.86 | |
| DEMA (21): | 25.24 | |
| Parabolic SAR (0,02-0,02-0,2): | 23.03 | |
| Elder Ray (13): | 0.07 | |
| Super Trend (3,10): | 26.64 | |
| Zig ZAG (10): | 25.60 | |
| VORTEX (21): | 0.9800 | |
| Stochastique (14,3,5): | 49.36 | |
| TEMA (21): | 25.33 | |
| Williams %R (14): | -37.53 | |
| Chande Momentum Oscillator (20): | 0.46 | |
| Repulse (5,40,3): | 1.4200 | |
| ROCnROLL: | -1 | |
| TRIX (15,9): | -0.1100 | |
| Courbe Coppock: | 0.01 |
| MA7: | 25.43 | |
| MA20: | 25.37 | |
| MA50: | 25.97 | |
| MA100: | 25.88 | |
| MAexp7: | 25.42 | |
| MAexp20: | 25.44 | |
| MAexp50: | 25.68 | |
| MAexp100: | 25.27 | |
| Price / MA7: | +1.10% | |
| Price / MA20: | +1.34% | |
| Price / MA50: | -1.00% | |
| Price / MA100: | -0.66% | |
| Price / MAexp7: | +1.14% | |
| Price / MAexp20: | +1.06% | |
| Price / MAexp50: | +0.12% | |
| Price / MAexp100: | +1.74% |
About author

Online


Add a comment
Comments
0 comments on the analysis CAE INC. - Daily