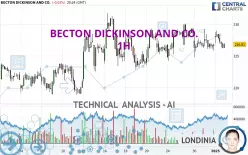
BECTON DICKINSON AND CO. - 1H - Technical analysis published on 01/02/2025 (GMT)
- 97
- 0
- Timeframe : 1H
- - Analysis generated on
- Status : NEUTRAL

Summary of the analysis

Additional analysis
Quotes
The BECTON DICKINSON AND CO. price is 226.81 USD. On the day, this instrument lost -0.03% and was between 226.18 USD and 229.00 USD. This implies that the price is at +0.28% from its lowest and at -0.96% from its highest.The Central Gaps scanner detects a bullish opening. A small advantage for buyers in the very short term.
Bullish opening
Type : Bullish
Timeframe : Openning
A study of price movements over other periods shows the following variations:
Near a new LOW record (1 year)
Type : Bearish
Timeframe : Weekly
Near a new HIGH record (1st january)
Type : Bullish
Timeframe : Weekly
Near a new LOW record (1 month)
Type : Bearish
Timeframe : Weekly
Technical
Technical analysis of BECTON DICKINSON AND CO. in 1H shows a neutral overall trend. This indecision could turn into a bearish trend due to the slightly bearish signals currently given by short-term moving averages. The Central Indicators market scanner is currently detecting several bearish and bullish signals that could impact this trend:
Bearish trend reversal : Moving Average 50
Type : Bearish
Timeframe : 1 hour
Bullish price crossover with Moving Average 100
Type : Bullish
Timeframe : 1 hour
An assessment of technical indicators shows a slightly bearish signal.
Caution: the Central Indicators scanner currently detects an excess:
RSI indicator: bullish divergence
Type : Bullish
Timeframe : 1 hour
Williams %R indicator is oversold : under -80
Type : Neutral
Timeframe : 1 hour
Momentum indicator is back under 0
Type : Bearish
Timeframe : 1 hour
The Central Patterns scanner, which studies chart patterns, resistances and supports, has identified these signals:
Near horizontal support
Type : Bullish
Timeframe : 1 hour
Support of channel is broken
Type : Bearish
Timeframe : 1 hour
The presence of a bullish Japanese candlestick pattern detected by Central Candlesticks that could cause a very short term rebound was also detected:
Bullish harami
Type : Bullish
Timeframe : 1 hour
| S3 | S2 | S1 | Price | R1 | R2 | R3 | |
|---|---|---|---|---|---|---|---|
| ProTrendLines | 219.51 | 222.20 | 224.40 | 226.81 | 227.38 | 230.30 | 231.74 |
| Change (%) | -3.22% | -2.03% | -1.06% | - | +0.25% | +1.54% | +2.17% |
| Change | -7.30 | -4.61 | -2.41 | - | +0.57 | +3.49 | +4.93 |
| Level | Intermediate | Major | Intermediate | - | Major | Major | Intermediate |
To determine price objectives, it is also possible to use the pivot points. Here is the price position in relation to pivot points:
| Pivot points | S3 | S2 | S1 | PP | R1 | R2 | R3 |
|---|---|---|---|---|---|---|---|
| Standard | 222.01 | 223.93 | 225.40 | 227.32 | 228.79 | 230.71 | 232.18 |
| Camarilla | 225.94 | 226.25 | 226.56 | 226.87 | 227.18 | 227.49 | 227.80 |
| Woodie | 221.79 | 223.82 | 225.18 | 227.21 | 228.57 | 230.60 | 231.96 |
| Fibonacci | 223.93 | 225.23 | 226.03 | 227.32 | 228.62 | 229.42 | 230.71 |
| Pivot points | S3 | S2 | S1 | PP | R1 | R2 | R3 |
|---|---|---|---|---|---|---|---|
| Standard | 219.17 | 221.68 | 225.08 | 227.59 | 230.99 | 233.50 | 236.90 |
| Camarilla | 226.87 | 227.41 | 227.95 | 228.49 | 229.03 | 229.57 | 230.12 |
| Woodie | 219.63 | 221.90 | 225.54 | 227.81 | 231.45 | 233.72 | 237.36 |
| Fibonacci | 221.68 | 223.93 | 225.33 | 227.59 | 229.84 | 231.24 | 233.50 |
| Pivot points | S3 | S2 | S1 | PP | R1 | R2 | R3 |
|---|---|---|---|---|---|---|---|
| Standard | 205.91 | 212.05 | 219.46 | 225.60 | 233.01 | 239.15 | 246.56 |
| Camarilla | 223.14 | 224.39 | 225.63 | 226.87 | 228.11 | 229.35 | 230.60 |
| Woodie | 206.55 | 212.37 | 220.10 | 225.92 | 233.65 | 239.47 | 247.20 |
| Fibonacci | 212.05 | 217.23 | 220.42 | 225.60 | 230.78 | 233.97 | 239.15 |
Numerical data
The following is the status of technical indicators and moving averages registered at the time this technical analysis was created:
| RSI (14): | 47.16 | |
| MACD (12,26,9): | -0.1100 | |
| Directional Movement: | -3.28 | |
| AROON (14): | -42.86 | |
| DEMA (21): | 227.08 | |
| Parabolic SAR (0,02-0,02-0,2): | 225.18 | |
| Elder Ray (13): | -0.54 | |
| Super Trend (3,10): | 225.35 | |
| Zig ZAG (10): | 226.93 | |
| VORTEX (21): | 0.9200 | |
| Stochastique (14,3,5): | 25.82 | |
| TEMA (21): | 226.91 | |
| Williams %R (14): | -67.89 | |
| Chande Momentum Oscillator (20): | -0.59 | |
| Repulse (5,40,3): | -0.0500 | |
| ROCnROLL: | -1 | |
| TRIX (15,9): | -0.0100 | |
| Courbe Coppock: | 0.15 |
| MA7: | 227.18 | |
| MA20: | 224.88 | |
| MA50: | 227.60 | |
| MA100: | 231.55 | |
| MAexp7: | 227.03 | |
| MAexp20: | 227.20 | |
| MAexp50: | 227.06 | |
| MAexp100: | 226.38 | |
| Price / MA7: | -0.16% | |
| Price / MA20: | +0.86% | |
| Price / MA50: | -0.35% | |
| Price / MA100: | -2.05% | |
| Price / MAexp7: | -0.10% | |
| Price / MAexp20: | -0.17% | |
| Price / MAexp50: | -0.11% | |
| Price / MAexp100: | +0.19% |
News
The last news published on BECTON DICKINSON AND CO. at the time of the generation of this analysis was as follows:
- BD to Present at Investor Healthcare Conferences
- BD Announces Exercise of Option to Purchase Additional Shares by Underwriters of Public Equity Offerings Increasing Total Gross Proceeds to $4.95 Billion
- BD Prices Offerings of $2.25 Billion of Common Stock and $2.25 Billion of Depositary Shares Representing Interests in Mandatory Convertible Preferred Stock
- BD and UniteOR Join Forces to Deliver an Integrated Tracking Solution for the Operating Room Setting
- BD Announces Offerings of $2.25 Billion of Common Stock and $2.25 Billion of Depositary Shares Representing Interests in Mandatory Convertible Preferred Stock
About author
Online


Add a comment
Comments
0 comments on the analysis BECTON DICKINSON AND CO. - 1H