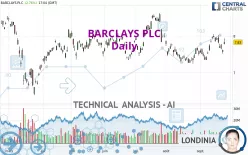
BARCLAYS PLC - Daily - Technical analysis published on 09/26/2023 (GMT)
- 151
- 0
Click here for a new analysis!
- Timeframe : Daily
- - Analysis generated on
- Status : INVALID

Summary of the analysis

Additional analysis
Quotes
The BARCLAYS PLC price is 7.83 USD. The price registered an increase of +2.76% on the session and was between 7.77 USD and 7.93 USD. This implies that the price is at +0.77% from its lowest and at -1.26% from its highest.The Central Gaps scanner detects the formation of a bullish gap marking the strong presence of buyers against sellers at the opening. This formed a quotation gap.
Opening Gap UP
Type : Bullish
Timeframe : Openning
So that you have an overall view of the price change, here is a table showing the variations over several periods:
Near a new HIGH record (1 month)
Type : Bullish
Timeframe : Weekly
Technical
Technical analysis of this Daily chart of BARCLAYS PLC indicates that the overall trend is slightly bullish. 60.71% of the signals given by moving averages are bullish. The overall trend remains fragile, as do the slightly bullish signals given by short-term moving averages. An assessment of moving averages reveals several bullish signals that could impact this trend:
Bullish price crossover with Moving Average 20
Type : Bullish
Timeframe : Daily
Bullish price crossover with Moving Average 50
Type : Bullish
Timeframe : Daily
Bullish price crossover with Moving Average 100
Type : Bullish
Timeframe : Daily
Bullish price crossover with adaptative moving average 20
Type : Bullish
Timeframe : Daily
Bullish price crossover with adaptative moving average 50
Type : Bullish
Timeframe : Daily
In fact, 10 technical indicators on 18 studied are currently bullish. Central Indicators, the detector scanner for these technical indicators has recently detected several signals:
Pivot points : price is over resistance 3
Type : Neutral
Timeframe : Daily
RSI indicator is back over 50
Type : Bullish
Timeframe : Daily
Price is back over the pivot point
Type : Bullish
Timeframe : Weekly
Williams %R indicator is back over -50
Type : Bullish
Timeframe : Daily
The Central Patterns scanner, which studies chart patterns, resistances and supports, has identified these signals:
Near resistance of channel
Type : Bearish
Timeframe : Daily
Near resistance of triangle
Type : Bearish
Timeframe : Daily
Horizontal resistance is broken
Type : Bullish
Timeframe : Daily
Central Candlesticks, the scanner specialised in Japanese candlesticks, detects these signals that could have an impact on the current short-term trend:
White gravestone / inverted hammer
Type : Neutral
Timeframe : Daily
Upside gap
Type : Bullish
Timeframe : Daily
Abandoned baby morning star
Type : Bullish
Timeframe : Daily
| S3 | S2 | S1 | Price | R1 | R2 | R3 | |
|---|---|---|---|---|---|---|---|
| ProTrendLines | 6.60 | 7.29 | 7.65 | 7.83 | 8.18 | 8.60 | 8.81 |
| Change (%) | -15.71% | -6.90% | -2.30% | - | +4.47% | +9.83% | +12.52% |
| Change | -1.23 | -0.54 | -0.18 | - | +0.35 | +0.77 | +0.98 |
| Level | Minor | Major | Intermediate | - | Intermediate | Intermediate | Minor |
Pivot points can also be used to set your price objectives. Here is the price situation in relation to pivot points:
| Pivot points | S3 | S2 | S1 | PP | R1 | R2 | R3 |
|---|---|---|---|---|---|---|---|
| Standard | 7.44 | 7.48 | 7.55 | 7.59 | 7.66 | 7.70 | 7.77 |
| Camarilla | 7.59 | 7.60 | 7.61 | 7.62 | 7.63 | 7.64 | 7.65 |
| Woodie | 7.46 | 7.49 | 7.57 | 7.60 | 7.68 | 7.71 | 7.79 |
| Fibonacci | 7.48 | 7.52 | 7.55 | 7.59 | 7.63 | 7.66 | 7.70 |
| Pivot points | S3 | S2 | S1 | PP | R1 | R2 | R3 |
|---|---|---|---|---|---|---|---|
| Standard | 7.13 | 7.39 | 7.52 | 7.78 | 7.91 | 8.17 | 8.30 |
| Camarilla | 7.55 | 7.59 | 7.62 | 7.66 | 7.70 | 7.73 | 7.77 |
| Woodie | 7.08 | 7.36 | 7.47 | 7.75 | 7.86 | 8.14 | 8.25 |
| Fibonacci | 7.39 | 7.54 | 7.63 | 7.78 | 7.93 | 8.02 | 8.17 |
| Pivot points | S3 | S2 | S1 | PP | R1 | R2 | R3 |
|---|---|---|---|---|---|---|---|
| Standard | 6.58 | 6.92 | 7.21 | 7.55 | 7.84 | 8.18 | 8.47 |
| Camarilla | 7.34 | 7.40 | 7.45 | 7.51 | 7.57 | 7.63 | 7.68 |
| Woodie | 6.57 | 6.91 | 7.20 | 7.54 | 7.83 | 8.17 | 8.46 |
| Fibonacci | 6.92 | 7.16 | 7.31 | 7.55 | 7.79 | 7.94 | 8.18 |
Numerical data
The following is the status of technical indicators and moving averages registered at the time this technical analysis was created:
| RSI (14): | 55.32 | |
| MACD (12,26,9): | 0.0500 | |
| Directional Movement: | 5.62 | |
| AROON (14): | 35.71 | |
| DEMA (21): | 7.75 | |
| Parabolic SAR (0,02-0,02-0,2): | 8.04 | |
| Elder Ray (13): | 0.12 | |
| Super Trend (3,10): | 7.56 | |
| Zig ZAG (10): | 7.82 | |
| VORTEX (21): | 0.9600 | |
| Stochastique (14,3,5): | 50.94 | |
| TEMA (21): | 7.82 | |
| Williams %R (14): | -31.69 | |
| Chande Momentum Oscillator (20): | 0.41 | |
| Repulse (5,40,3): | -0.5900 | |
| ROCnROLL: | 1 | |
| TRIX (15,9): | 0.0800 | |
| Courbe Coppock: | 7.49 |
| MA7: | 7.78 | |
| MA20: | 7.68 | |
| MA50: | 7.73 | |
| MA100: | 7.77 | |
| MAexp7: | 7.75 | |
| MAexp20: | 7.70 | |
| MAexp50: | 7.70 | |
| MAexp100: | 7.71 | |
| Price / MA7: | +0.64% | |
| Price / MA20: | +1.95% | |
| Price / MA50: | +1.29% | |
| Price / MA100: | +0.77% | |
| Price / MAexp7: | +1.03% | |
| Price / MAexp20: | +1.69% | |
| Price / MAexp50: | +1.69% | |
| Price / MAexp100: | +1.56% |
News
Don't forget to follow the news on BARCLAYS PLC. At the time of publication of this analysis, the latest news was as follows:
- INVESTOR ACTION ALERT: The Schall Law Firm Encourages Investors in Barclays PLC With Losses of $100,000 to Contact the Firm
- SHAREHOLDER DEADLINE NOTICE: The Schall Law Firm Encourages Investors in Barclays PLC With Losses of $100,000 to Contact the Firm
About author
Online


Add a comment
Comments
0 comments on the analysis BARCLAYS PLC - Daily