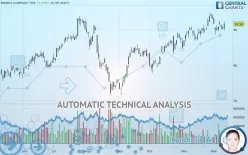
BRINKS COMPANY THE - Daily - Technical analysis published on 12/12/2019 (GMT)
- 230
- 0
- Who voted?
Click here for a new analysis!
- Timeframe : Daily
- - Analysis generated on
- Status : TARGET REACHED

Summary of the analysis

Additional analysis
Quotes
The BRINKS COMPANY THE price is 91.58 USD. On the day, this instrument gained +1.55% and was between 89.74 USD and 92.24 USD. This implies that the price is at +2.05% from its lowest and at -0.72% from its highest.The Central Gaps scanner detects a bullish opening marking the presence of buyers ahead of sellers at the opening but not sufficiently marked to allow the price to register a quotation gap.
Bullish opening
Type : Bullish
Timeframe : Openning
Here is a more detailed summary of the historical variations registered by BRINKS COMPANY THE:
Near a new HIGH record (5 years)
Type : Bullish
Timeframe : Weekly
Near a new HIGH record (1 year)
Type : Bullish
Timeframe : Weekly
Near a new HIGH record (1st january)
Type : Bullish
Timeframe : Weekly
Technical
A technical analysis in Daily of this BRINKS COMPANY THE chart shows a strongly bullish trend. The signals given by the moving averages are 92.86% bullish. This strong bullish trend is confirmed by the strong signals currently being given by short-term moving averages. An assessment of moving averages reveals a bullish signal that could impact this trend:
Bullish price crossover with Moving Average 20
Type : Bullish
Timeframe : Daily
In fact, only 7 technical indicators out of 18 studied are currently bullish. Central Indicators, the scanner specialised in technical indicators, has identified these signals:
Pivot points : price is over resistance 3
Type : Neutral
Timeframe : Daily
Price is back under the pivot point
Type : Bearish
Timeframe : Daily
Williams %R indicator is back over -50
Type : Bullish
Timeframe : Daily
Central Patterns, the scanner specializing in chart patterns, did not identify any signals.
The Central Candlesticks scanner which studies Japanese candlesticks did not detect anything.
| S3 | S2 | S1 | Price | R1 | |
|---|---|---|---|---|---|
| ProTrendLines | 85.54 | 87.85 | 89.79 | 91.58 | 92.96 |
| Change (%) | -6.60% | -4.07% | -1.95% | - | +1.51% |
| Change | -6.04 | -3.73 | -1.79 | - | +1.38 |
| Level | Intermediate | Major | Intermediate | - | Major |
Attention could also be paid to pivot points to set price objectives:
| Pivot points | S3 | S2 | S1 | PP | R1 | R2 | R3 |
|---|---|---|---|---|---|---|---|
| Standard | 89.06 | 89.48 | 89.83 | 90.25 | 90.60 | 91.02 | 91.37 |
| Camarilla | 89.97 | 90.04 | 90.11 | 90.18 | 90.25 | 90.32 | 90.39 |
| Woodie | 89.03 | 89.46 | 89.80 | 90.23 | 90.57 | 91.00 | 91.34 |
| Fibonacci | 89.48 | 89.77 | 89.96 | 90.25 | 90.54 | 90.73 | 91.02 |
| Pivot points | S3 | S2 | S1 | PP | R1 | R2 | R3 |
|---|---|---|---|---|---|---|---|
| Standard | 83.80 | 86.15 | 88.82 | 91.17 | 93.84 | 96.20 | 98.87 |
| Camarilla | 90.11 | 90.57 | 91.03 | 91.49 | 91.95 | 92.41 | 92.87 |
| Woodie | 83.96 | 86.23 | 88.98 | 91.25 | 94.00 | 96.27 | 99.03 |
| Fibonacci | 86.15 | 88.07 | 89.25 | 91.17 | 93.09 | 94.28 | 96.20 |
| Pivot points | S3 | S2 | S1 | PP | R1 | R2 | R3 |
|---|---|---|---|---|---|---|---|
| Standard | 77.52 | 81.26 | 87.13 | 90.87 | 96.74 | 100.48 | 106.35 |
| Camarilla | 90.36 | 91.24 | 92.12 | 93.00 | 93.88 | 94.76 | 95.64 |
| Woodie | 78.59 | 81.79 | 88.20 | 91.40 | 97.81 | 101.01 | 107.41 |
| Fibonacci | 81.26 | 84.93 | 87.20 | 90.87 | 94.54 | 96.81 | 100.48 |
Numerical data
The following are the details of the technical indicators and moving averages that were collected to generate this technical analysis:
| RSI (14): | 56.94 | |
| MACD (12,26,9): | 0.9100 | |
| Directional Movement: | 4.30 | |
| AROON (14): | -21.43 | |
| DEMA (21): | 91.86 | |
| Parabolic SAR (0,02-0,02-0,2): | 93.91 | |
| Elder Ray (13): | 0.13 | |
| Super Trend (3,10): | 88.92 | |
| Zig ZAG (10): | 91.58 | |
| VORTEX (21): | 1.0100 | |
| Stochastique (14,3,5): | 36.61 | |
| TEMA (21): | 91.43 | |
| Williams %R (14): | -49.59 | |
| Chande Momentum Oscillator (20): | 1.24 | |
| Repulse (5,40,3): | 0.5300 | |
| ROCnROLL: | 1 | |
| TRIX (15,9): | 0.2000 | |
| Courbe Coppock: | 2.74 |
| MA7: | 90.57 | |
| MA20: | 90.68 | |
| MA50: | 87.51 | |
| MA100: | 84.98 | |
| MAexp7: | 90.96 | |
| MAexp20: | 90.45 | |
| MAexp50: | 88.18 | |
| MAexp100: | 85.67 | |
| Price / MA7: | +1.12% | |
| Price / MA20: | +0.99% | |
| Price / MA50: | +4.65% | |
| Price / MA100: | +7.77% | |
| Price / MAexp7: | +0.68% | |
| Price / MAexp20: | +1.25% | |
| Price / MAexp50: | +3.86% | |
| Price / MAexp100: | +6.90% |
News
The latest news and videos published on BRINKS COMPANY THE at the time of the analysis were as follows:
- The Brink's Co. to Host Earnings Call
- Brink’s Declares Quarterly Dividend
- Brink’s Hosting Investor Day March 2 in New York
- Brink’s Fourth-Quarter Earnings Release and Conference Call Scheduled for February 8
-
 Family outraged over clemency for Brinks robbery accomplice
About author

Online


Add a comment
Comments
0 comments on the analysis BRINKS COMPANY THE - Daily