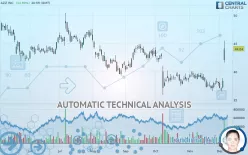
AZZ INC. - Daily - Technical analysis published on 12/05/2019 (GMT)
- 346
- 0
- Who voted?
Click here for a new analysis!
- Timeframe : Daily
- - Analysis generated on
- Status : LEVEL MAINTAINED

Summary of the analysis

Additional analysis
Quotes
The AZZ INC. rating is 44.04 USD. On the day, this instrument gained +14.90% with the lowest point at 41.60 USD and the highest point at 45.50 USD. The deviation from the price is +5.87% for the low point and -3.21% for the high point.A bullish gap was detected at the opening by the Central Gaps scanner. There are a lot of buyers and they have the upper hand in the very short term.
Opening Gap UP
Type : Bullish
Timeframe : Openning
So that you have an overall view of the price change, here is a table showing the variations over several periods:
Near a new LOW record (5 years)
Type : Bearish
Timeframe : Weekly
Technical
A technical analysis in Daily of this AZZ INC. chart shows a slightly bullish trend. 60.71% of the signals given by moving averages are bullish. This slightly bullish trend could be reinforced by the strong bullish signals given by short-term moving averages. An assessment of moving averages reveals several bullish signals that could impact this trend:
Bullish trend reversal : adaptative moving average 20
Type : Bullish
Timeframe : Daily
Bullish price crossover with Moving Average 20
Type : Bullish
Timeframe : Daily
In fact, 14 technical indicators on 18 studied are currently positioned bullish. But beware of excesses. The Central Indicators scanner currently detects this:
MACD indicator: bullish divergence
Type : Bullish
Timeframe : Daily
RSI indicator: bullish divergence
Type : Bullish
Timeframe : Daily
Williams %R indicator is overbought : over -20
Type : Neutral
Timeframe : Daily
Pivot points : price is over resistance 3
Type : Neutral
Timeframe : Daily
Pivot points : price is over resistance 3
Type : Neutral
Timeframe : Weekly
RSI indicator is back over 50
Type : Bullish
Timeframe : Daily
MACD crosses UP its Moving Average
Type : Bullish
Timeframe : Daily
Parabolic SAR indicator bullish reversal
Type : Bullish
Timeframe : Daily
Williams %R indicator is back over -50
Type : Bullish
Timeframe : Daily
Central Patterns, the scanner specializing in chart patterns, did not identify any signals.
Central Candlesticks, the scanner specialised in Japanese candlesticks, detects a bullish signal that could support the hypothesis of a small rebound in the very short term:
White morning star
Type : Bullish
Timeframe : Daily
| S3 | S2 | S1 | Price | R1 | R2 | R3 | |
|---|---|---|---|---|---|---|---|
| ProTrendLines | 37.74 | 39.62 | 42.09 | 44.04 | 44.55 | 49.18 | 51.55 |
| Change (%) | -14.31% | -10.04% | -4.43% | - | +1.16% | +11.67% | +17.05% |
| Change | -6.30 | -4.42 | -1.95 | - | +0.51 | +5.14 | +7.51 |
| Level | Major | Intermediate | Minor | - | Intermediate | Intermediate | Intermediate |
Attention could also be paid to pivot points to set price objectives:
| Pivot points | S3 | S2 | S1 | PP | R1 | R2 | R3 |
|---|---|---|---|---|---|---|---|
| Standard | 35.43 | 36.22 | 37.28 | 38.06 | 39.12 | 39.91 | 40.96 |
| Camarilla | 37.82 | 37.99 | 38.16 | 38.33 | 38.50 | 38.67 | 38.84 |
| Woodie | 35.57 | 36.29 | 37.41 | 38.13 | 39.25 | 39.97 | 41.10 |
| Fibonacci | 36.22 | 36.92 | 37.36 | 38.06 | 38.77 | 39.20 | 39.91 |
| Pivot points | S3 | S2 | S1 | PP | R1 | R2 | R3 |
|---|---|---|---|---|---|---|---|
| Standard | 35.21 | 36.13 | 37.05 | 37.97 | 38.89 | 39.81 | 40.73 |
| Camarilla | 37.46 | 37.63 | 37.80 | 37.97 | 38.14 | 38.31 | 38.48 |
| Woodie | 35.21 | 36.13 | 37.05 | 37.97 | 38.89 | 39.81 | 40.73 |
| Fibonacci | 36.13 | 36.83 | 37.27 | 37.97 | 38.67 | 39.11 | 39.81 |
| Pivot points | S3 | S2 | S1 | PP | R1 | R2 | R3 |
|---|---|---|---|---|---|---|---|
| Standard | 32.80 | 34.66 | 36.31 | 38.18 | 39.83 | 41.69 | 43.35 |
| Camarilla | 37.00 | 37.33 | 37.65 | 37.97 | 38.29 | 38.62 | 38.94 |
| Woodie | 32.69 | 34.61 | 36.21 | 38.12 | 39.73 | 41.64 | 43.25 |
| Fibonacci | 34.66 | 36.00 | 36.83 | 38.18 | 39.52 | 40.35 | 41.69 |
Numerical data
The following is the status of technical indicators and moving averages registered at the time this technical analysis was created:
| RSI (14): | 74.31 | |
| MACD (12,26,9): | 0.0700 | |
| Directional Movement: | 32.22 | |
| AROON (14): | 14.29 | |
| DEMA (21): | 38.53 | |
| Parabolic SAR (0,02-0,02-0,2): | 36.49 | |
| Elder Ray (13): | 4.80 | |
| Super Trend (3,10): | 38.58 | |
| Zig ZAG (10): | 44.04 | |
| VORTEX (21): | 0.9700 | |
| Stochastique (14,3,5): | 53.21 | |
| TEMA (21): | 39.11 | |
| Williams %R (14): | -16.20 | |
| Chande Momentum Oscillator (20): | 6.80 | |
| Repulse (5,40,3): | 6.2500 | |
| ROCnROLL: | 1 | |
| TRIX (15,9): | -0.1500 | |
| Courbe Coppock: | 0.89 |
| MA7: | 38.66 | |
| MA20: | 38.40 | |
| MA50: | 39.21 | |
| MA100: | 41.08 | |
| MAexp7: | 39.31 | |
| MAexp20: | 38.65 | |
| MAexp50: | 39.34 | |
| MAexp100: | 40.59 | |
| Price / MA7: | +13.92% | |
| Price / MA20: | +14.69% | |
| Price / MA50: | +12.32% | |
| Price / MA100: | +7.21% | |
| Price / MAexp7: | +12.03% | |
| Price / MAexp20: | +13.95% | |
| Price / MAexp50: | +11.95% | |
| Price / MAexp100: | +8.50% |
News
The latest news and videos published on AZZ INC. at the time of the analysis were as follows:
- AZZ Inc. Reports Financial Results for the Second Quarter of Fiscal Year 2020; Raises Fiscal Year 2020 Revenue and Earnings Guidance
- AZZ Inc. to Review Second Quarter Fiscal Year 2020 Financial Results on Thursday, December 5, 2019 at 11:00 a.m. ET
- SHAREHOLDER ALERT: Pomerantz Law Firm Investigates Claims On Behalf of Investors of AZZ, Inc. - AZZ
- ROSEN, A LEADING GLOBAL LAW FIRM, Announces Filing of Securities Class Action Lawsuit Against AZZ Inc. - AZZ
- INVESTOR ALERT - AZZ, Inc. (AZZ) - Bronstein, Gewirtz & Grossman, LLC Notifies Investors of Class Action and Lead Plaintiff Deadline: January 3, 2020
About author

Online


Add a comment
Comments
0 comments on the analysis AZZ INC. - Daily