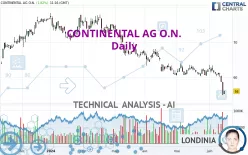
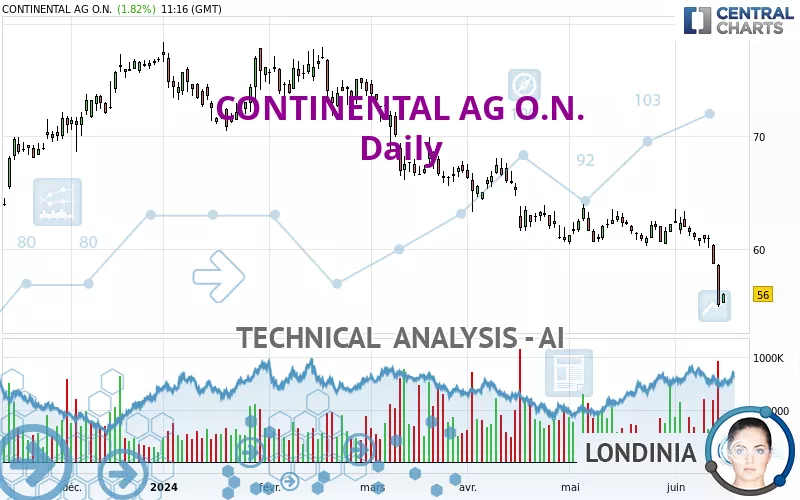
CONTINENTAL AG O.N. - Daily - Technical analysis published on 06/17/2024 (GMT)
- 166
- 0
Click here for a new analysis!
- Timeframe : Daily
- - Analysis generated on
- Status : INVALID
Summary of the analysis

Additional analysis
Quotes
The CONTINENTAL AG O.N. rating is 56.00 EUR. On the day, this instrument gained +1.82% with the lowest point at 55.18 EUR and the highest point at 56.06 EUR. The deviation from the price is +1.49% for the low point and -0.11% for the high point.The Central Gaps scanner detects a bullish opening. A small advantage for buyers in the very short term.
Bullish opening
Type : Bullish
Timeframe : Openning
A study of price movements over other periods shows the following variations:
Near a new LOW record (1 year)
Type : Bearish
Timeframe : Weekly
Near a new LOW record (1st january)
Type : Bearish
Timeframe : Weekly
Near a new LOW record (1 month)
Type : Bearish
Timeframe : Weekly
Technical
Technical analysis of this Daily chart of CONTINENTAL AG O.N. indicates that the overall trend is strongly bearish. 92.86% of the signals given by moving averages are bearish. The overall trend is supported by the strong bearish signals from short-term moving averages. There is no crossing of moving average by the price or crossing of moving averages between themselves.
An assessment of technical indicators does not currently provide any relevant information on the direction of future price movements.
Caution: the Central Indicators scanner currently detects an excess:
RSI indicator is oversold : under 30
Type : Neutral
Timeframe : Daily
CCI indicator is oversold : under -100
Type : Neutral
Timeframe : Daily
Previous candle closed under Bollinger bands
Type : Neutral
Timeframe : Daily
Williams %R indicator is oversold : under -80
Type : Neutral
Timeframe : Daily
The Central Patterns scanner, which studies chart patterns, resistances and supports, has identified these signals:
Near horizontal support
Type : Bullish
Timeframe : Daily
Support of channel is broken
Type : Bearish
Timeframe : Daily
Central Candlesticks, the scanner specialised in Japanese candlesticks, detects these bullish signals that could support the hypothesis of a small rebound in the very short term:
Bullish harami
Type : Bullish
Timeframe : Daily
Bullish harami cross
Type : Bullish
Timeframe : Daily
| S3 | S2 | S1 | Price | R1 | R2 | R3 | |
|---|---|---|---|---|---|---|---|
| ProTrendLines | 24.33 | 39.63 | 51.75 | 56.00 | 57.36 | 62.30 | 63.72 |
| Change (%) | -56.55% | -29.23% | -7.59% | - | +2.43% | +11.25% | +13.79% |
| Change | -31.67 | -16.37 | -4.25 | - | +1.36 | +6.30 | +7.72 |
| Level | Minor | Major | Minor | - | Major | Major | Minor |
To determine price objectives, it is also possible to use the pivot points. Here is the price position in relation to pivot points:
| Pivot points | S3 | S2 | S1 | PP | R1 | R2 | R3 |
|---|---|---|---|---|---|---|---|
| Standard | 49.88 | 52.36 | 53.68 | 56.16 | 57.48 | 59.96 | 61.28 |
| Camarilla | 53.96 | 54.30 | 54.65 | 55.00 | 55.35 | 55.70 | 56.05 |
| Woodie | 49.30 | 52.07 | 53.10 | 55.87 | 56.90 | 59.67 | 60.70 |
| Fibonacci | 52.36 | 53.81 | 54.71 | 56.16 | 57.61 | 58.51 | 59.96 |
| Pivot points | S3 | S2 | S1 | PP | R1 | R2 | R3 |
|---|---|---|---|---|---|---|---|
| Standard | 46.41 | 50.63 | 52.81 | 57.03 | 59.21 | 63.43 | 65.61 |
| Camarilla | 53.24 | 53.83 | 54.41 | 55.00 | 55.59 | 56.17 | 56.76 |
| Woodie | 45.40 | 50.12 | 51.80 | 56.52 | 58.20 | 62.92 | 64.60 |
| Fibonacci | 50.63 | 53.07 | 54.58 | 57.03 | 59.47 | 60.98 | 63.43 |
| Pivot points | S3 | S2 | S1 | PP | R1 | R2 | R3 |
|---|---|---|---|---|---|---|---|
| Standard | 56.54 | 58.40 | 60.32 | 62.18 | 64.10 | 65.96 | 67.88 |
| Camarilla | 61.20 | 61.55 | 61.89 | 62.24 | 62.59 | 62.93 | 63.28 |
| Woodie | 56.57 | 58.42 | 60.35 | 62.20 | 64.13 | 65.98 | 67.91 |
| Fibonacci | 58.40 | 59.84 | 60.74 | 62.18 | 63.62 | 64.52 | 65.96 |
Numerical data
The following is the status of the technical indicators and moving averages at the time of publication of this technical analysis:
| RSI (14): | 27.96 | |
| MACD (12,26,9): | -1.1800 | |
| Directional Movement: | -31.48 | |
| AROON (14): | -64.29 | |
| DEMA (21): | 58.94 | |
| Parabolic SAR (0,02-0,02-0,2): | 63.10 | |
| Elder Ray (13): | -3.94 | |
| Super Trend (3,10): | 59.82 | |
| Zig ZAG (10): | 56.00 | |
| VORTEX (21): | 0.7000 | |
| Stochastique (14,3,5): | 5.06 | |
| TEMA (21): | 58.27 | |
| Williams %R (14): | -86.67 | |
| Chande Momentum Oscillator (20): | -5.62 | |
| Repulse (5,40,3): | -5.5000 | |
| ROCnROLL: | 2 | |
| TRIX (15,9): | -0.1100 | |
| Courbe Coppock: | 9.06 |
| MA7: | 59.07 | |
| MA20: | 60.75 | |
| MA50: | 61.49 | |
| MA100: | 65.35 | |
| MAexp7: | 58.39 | |
| MAexp20: | 60.22 | |
| MAexp50: | 61.87 | |
| MAexp100: | 63.81 | |
| Price / MA7: | -5.20% | |
| Price / MA20: | -7.82% | |
| Price / MA50: | -8.93% | |
| Price / MA100: | -14.31% | |
| Price / MAexp7: | -4.09% | |
| Price / MAexp20: | -7.01% | |
| Price / MAexp50: | -9.49% | |
| Price / MAexp100: | -12.24% |
News
The latest news and videos published on CONTINENTAL AG O.N. at the time of the analysis were as follows:
- EQS-News: Continental AG: After a Weak Start: Continental Confirms Its Full-year Outlook
- EQS-Adhoc: Continental AG: Continental Releases Preliminary Figures for First Quarter 2024 – Sales and Adjusted EBIT Margin as well as Adjusted Free Cash Flow Below Market Expectation
- EQS-News: Invitation to the Annual Shareholders’ Meeting
- EQS-News: Continental Increases Earnings in 2023 and Targets Further Improvement This Year
- EQS-News: Third Quarter: Continental Increases Automotive Earnings and Adjusted Free Cash Flow
About author
Online


Add a comment
Comments
0 comments on the analysis CONTINENTAL AG O.N. - Daily