EMEREN GROUP LTD ADS - Daily - Technical analysis published on 01/26/2021 (GMT)
- 209
- 0
Click here for a new analysis!
- Timeframe : Daily
- - Analysis generated on
- Status : INVALID

Summary of the analysis

Additional analysis
Quotes
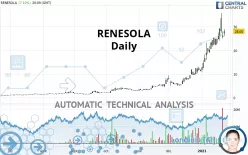
The RENESOLA price is 28.05 USD. The price registered an increase of +7.10% on the session and was traded between 26.02 USD and 28.92 USD over the period. The price is currently at +7.80% from its lowest and -3.01% from its highest.The Central Gaps scanner detects a bullish opening. A small advantage for buyers in the very short term.
Bullish opening
Type : Bullish
Timeframe : Openning
Here is a more detailed summary of the historical variations registered by RENESOLA:
Abnormal volumes
Timeframe : 5 days
Abnormal volumes
Timeframe : 20 days
Abnormal volumes
Timeframe : 50 days
Technical
Technical analysis of RENESOLA in Daily shows a strongly overall bullish trend. 92.86% of the signals given by moving averages are bullish. This strongly bullish trend is supported by the strong bullish signals given by short-term moving averages. The Central Indicators scanner does not detect any result on moving averages that would impact this trend.
In fact, 14 technical indicators on 18 studied are currently positioned bullish. But beware of excesses. The Central Indicators scanner currently detects this:
Williams %R indicator is overbought : over -20
Type : Neutral
Timeframe : Daily
Pivot points : price is over resistance 1
Type : Neutral
Timeframe : Daily
Price is back over the pivot point
Type : Bullish
Timeframe : Weekly
No signals are given by Central Patterns, a market scanner specialised in chart patterns, resistances and supports.
The Central Candlesticks scanner, specialised in Japanese candlesticks, did not identify any signals.
| S3 | S2 | S1 | Price | R1 | R2 | R3 | |
|---|---|---|---|---|---|---|---|
| ProTrendLines | 7.93 | 10.38 | 12.50 | 28.05 | 28.80 | 72.75 | 139.00 |
| Change (%) | -71.73% | -62.99% | -55.44% | - | +2.67% | +159.36% | +395.54% |
| Change | -20.12 | -17.67 | -15.55 | - | +0.75 | +44.70 | +110.95 |
| Level | Major | Major | Minor | - | Intermediate | Major | Minor |
To determine price objectives, it is also possible to use the pivot points. Here is the price position in relation to pivot points:
| Pivot points | S3 | S2 | S1 | PP | R1 | R2 | R3 |
|---|---|---|---|---|---|---|---|
| Standard | 21.84 | 23.44 | 24.81 | 26.41 | 27.78 | 29.38 | 30.75 |
| Camarilla | 25.37 | 25.65 | 25.92 | 26.19 | 26.46 | 26.73 | 27.01 |
| Woodie | 21.74 | 23.38 | 24.71 | 26.35 | 27.68 | 29.32 | 30.65 |
| Fibonacci | 23.44 | 24.57 | 25.27 | 26.41 | 27.54 | 28.24 | 29.38 |
| Pivot points | S3 | S2 | S1 | PP | R1 | R2 | R3 |
|---|---|---|---|---|---|---|---|
| Standard | 11.78 | 17.03 | 25.29 | 30.53 | 38.79 | 44.04 | 52.30 |
| Camarilla | 29.84 | 31.07 | 32.31 | 33.55 | 34.79 | 36.03 | 37.26 |
| Woodie | 13.29 | 17.78 | 26.80 | 31.29 | 40.30 | 44.79 | 53.81 |
| Fibonacci | 17.03 | 22.19 | 25.37 | 30.53 | 35.69 | 38.88 | 44.04 |
| Pivot points | S3 | S2 | S1 | PP | R1 | R2 | R3 |
|---|---|---|---|---|---|---|---|
| Standard | -1.56 | 1.74 | 6.59 | 9.89 | 14.74 | 18.04 | 22.89 |
| Camarilla | 9.19 | 9.94 | 10.68 | 11.43 | 12.18 | 12.92 | 13.67 |
| Woodie | -0.80 | 2.13 | 7.36 | 10.28 | 15.51 | 18.43 | 23.66 |
| Fibonacci | 1.74 | 4.86 | 6.78 | 9.89 | 13.01 | 14.93 | 18.04 |
Numerical data
The following is the status of the technical indicators and moving averages at the time of publication of this technical analysis:
| RSI (14): | 64.71 | |
| MACD (12,26,9): | 5.0800 | |
| Directional Movement: | 32.85 | |
| AROON (14): | 85.71 | |
| DEMA (21): | 28.00 | |
| Parabolic SAR (0,02-0,02-0,2): | 25.03 | |
| Elder Ray (13): | 3.11 | |
| Super Trend (3,10): | 20.83 | |
| Zig ZAG (10): | 27.52 | |
| VORTEX (21): | 1.1200 | |
| Stochastique (14,3,5): | 70.22 | |
| TEMA (21): | 30.29 | |
| Williams %R (14): | -38.91 | |
| Chande Momentum Oscillator (20): | 9.73 | |
| Repulse (5,40,3): | 18.5100 | |
| ROCnROLL: | 1 | |
| TRIX (15,9): | 5.3000 | |
| Courbe Coppock: | 205.93 |
| MA7: | 27.17 | |
| MA20: | 20.59 | |
| MA50: | 12.24 | |
| MA100: | 7.52 | |
| MAexp7: | 26.98 | |
| MAexp20: | 21.68 | |
| MAexp50: | 14.76 | |
| MAexp100: | 10.00 | |
| Price / MA7: | +3.24% | |
| Price / MA20: | +36.23% | |
| Price / MA50: | +129.17% | |
| Price / MA100: | +273.01% | |
| Price / MAexp7: | +3.97% | |
| Price / MAexp20: | +29.38% | |
| Price / MAexp50: | +90.04% | |
| Price / MAexp100: | +180.50% |
News
The last news published on RENESOLA at the time of the generation of this analysis was as follows:
- ReneSola Power Announces $250 Million Registered Direct Offering of ADSs
- ReneSola Power Announces Closing of $40.0 Million Registered Direct Offering
- ReneSola Power Announces Sale of 12.3 MW of Projects in Hungary
- ReneSola Announces $40.0 Million Registered Direct Offering
- ReneSola Power and Eiffel Investment Group Announce MOU for Joint Venture to Fund Solar Development in Europe
About author

Online


Add a comment
Comments
0 comments on the analysis EMEREN GROUP LTD ADS - Daily