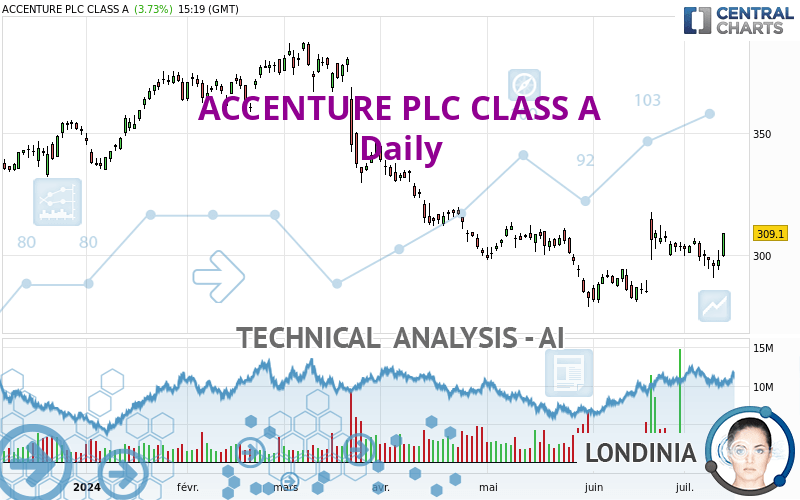
ACCENTURE PLC CLASS A - Daily - Technical analysis published on 07/12/2024 (GMT)
- 116
- 0
Click here for a new analysis!
- Timeframe : Daily
- - Analysis generated on
- Status : TARGET REACHED

Summary of the analysis

Additional analysis
Quotes
The ACCENTURE PLC CLASS A rating is 309.10 USD. The price has increased by +3.73% since the last closing and was between 299.03 USD and 309.17 USD. This implies that the price is at +3.37% from its lowest and at -0.02% from its highest.The Central Gaps scanner detects a bullish opening marking the presence of buyers ahead of sellers at the opening but not sufficiently marked to allow the price to register a quotation gap.
Bullish opening
Type : Bullish
Timeframe : Openning
So that you have an overall view of the price change, here is a table showing the variations over several periods:
Near a new HIGH record (1 month)
Type : Bullish
Timeframe : Weekly
Technical
A technical analysis in Daily of this ACCENTURE PLC CLASS A chart shows a neutral trend. The strong bullish signals currently being given by short-term moving averages could allow the overall trend to return to bullish. An assessment of moving averages reveals a bullish signal that could impact this trend:
Moving Average bullish crossovers : MA20 & MA50
Type : Bullish
Timeframe : Daily
In fact, 12 technical indicators on 18 studied are currently positioned bullish. Caution: the Central Indicators scanner currently detects an excess:
Williams %R indicator is overbought : over -20
Type : Neutral
Timeframe : Daily
Pivot points : price is over resistance 1
Type : Neutral
Timeframe : Weekly
Pivot points : price is over resistance 2
Type : Neutral
Timeframe : Daily
RSI indicator is back over 50
Type : Bullish
Timeframe : Daily
MACD crosses UP its Moving Average
Type : Bullish
Timeframe : Daily
Ichimoku - Bullish crossover : Tenkan & Kijun
Type : Bullish
Timeframe : Daily
Momentum indicator is back over 0
Type : Bullish
Timeframe : Daily
Central Patterns, the market scanner focusing on chart patterns, resistances and supports found these results:
Near horizontal resistance
Type : Bearish
Timeframe : Daily
Resistance of channel is broken
Type : Bullish
Timeframe : Daily
The Central Candlesticks scanner, specialised in Japanese candlesticks, did not identify any signals.
| S3 | S2 | S1 | Price | R1 | R2 | R3 | |
|---|---|---|---|---|---|---|---|
| ProTrendLines | 280.71 | 296.93 | 308.02 | 309.10 | 318.70 | 332.43 | 357.93 |
| Change (%) | -9.18% | -3.94% | -0.35% | - | +3.11% | +7.55% | +15.80% |
| Change | -28.39 | -12.17 | -1.08 | - | +9.60 | +23.33 | +48.83 |
| Level | Major | Major | Major | - | Major | Minor | Minor |
Pivot points can also be used to set your price objectives. Here is the price situation in relation to pivot points:
| Pivot points | S3 | S2 | S1 | PP | R1 | R2 | R3 |
|---|---|---|---|---|---|---|---|
| Standard | 285.72 | 289.85 | 293.92 | 298.05 | 302.12 | 306.25 | 310.32 |
| Camarilla | 295.74 | 296.49 | 297.24 | 297.99 | 298.74 | 299.49 | 300.25 |
| Woodie | 285.69 | 289.84 | 293.89 | 298.04 | 302.09 | 306.24 | 310.29 |
| Fibonacci | 289.85 | 292.98 | 294.92 | 298.05 | 301.18 | 303.12 | 306.25 |
| Pivot points | S3 | S2 | S1 | PP | R1 | R2 | R3 |
|---|---|---|---|---|---|---|---|
| Standard | 285.11 | 290.74 | 294.28 | 299.91 | 303.45 | 309.08 | 312.62 |
| Camarilla | 295.30 | 296.14 | 296.98 | 297.82 | 298.66 | 299.50 | 300.34 |
| Woodie | 284.07 | 290.22 | 293.24 | 299.39 | 302.41 | 308.56 | 311.58 |
| Fibonacci | 290.74 | 294.24 | 296.41 | 299.91 | 303.41 | 305.58 | 309.08 |
| Pivot points | S3 | S2 | S1 | PP | R1 | R2 | R3 |
|---|---|---|---|---|---|---|---|
| Standard | 244.80 | 261.95 | 282.02 | 299.17 | 319.24 | 336.39 | 356.46 |
| Camarilla | 291.85 | 295.26 | 298.67 | 302.08 | 305.49 | 308.90 | 312.32 |
| Woodie | 246.25 | 262.68 | 283.47 | 299.90 | 320.69 | 337.12 | 357.91 |
| Fibonacci | 261.95 | 276.17 | 284.96 | 299.17 | 313.39 | 322.18 | 336.39 |
Numerical data
The following is the status of the technical indicators and moving averages at the time of publication of this technical analysis:
| RSI (14): | 60.64 | |
| MACD (12,26,9): | 1.0500 | |
| Directional Movement: | 6.50 | |
| AROON (14): | -78.57 | |
| DEMA (21): | 299.95 | |
| Parabolic SAR (0,02-0,02-0,2): | 313.78 | |
| Elder Ray (13): | 4.06 | |
| Super Trend (3,10): | 285.55 | |
| Zig ZAG (10): | 308.45 | |
| VORTEX (21): | 0.9700 | |
| Stochastique (14,3,5): | 48.89 | |
| TEMA (21): | 303.17 | |
| Williams %R (14): | -10.97 | |
| Chande Momentum Oscillator (20): | 2.79 | |
| Repulse (5,40,3): | 4.3800 | |
| ROCnROLL: | 1 | |
| TRIX (15,9): | 0.0400 | |
| Courbe Coppock: | 3.04 |
| MA7: | 299.70 | |
| MA20: | 298.39 | |
| MA50: | 298.01 | |
| MA100: | 321.46 | |
| MAexp7: | 300.75 | |
| MAexp20: | 299.00 | |
| MAexp50: | 302.65 | |
| MAexp100: | 312.65 | |
| Price / MA7: | +3.14% | |
| Price / MA20: | +3.59% | |
| Price / MA50: | +3.72% | |
| Price / MA100: | -3.84% | |
| Price / MAexp7: | +2.78% | |
| Price / MAexp20: | +3.38% | |
| Price / MAexp50: | +2.13% | |
| Price / MAexp100: | -1.14% |
News
The last news published on ACCENTURE PLC CLASS A at the time of the generation of this analysis was as follows:
- Palo Alto Networks and Accenture Team to Secure the GenAI Transformation Journey
- BNY Mellon Collaborates with Accenture to Drive Accelerated Growth for Clients
- Best Buy, Google Cloud, and Accenture Partner to Create a Better Customer Support Experience with Generative AI
- Accenture and Google Cloud Launch Joint Generative AI Center of Excellence to Help Enterprises Harness the Value of Generative AI
- Stagwell (STGW) Completes Divestment of ConcentricLife to Accenture for $245 Million
About author
Online


Add a comment
Comments
0 comments on the analysis ACCENTURE PLC CLASS A - Daily