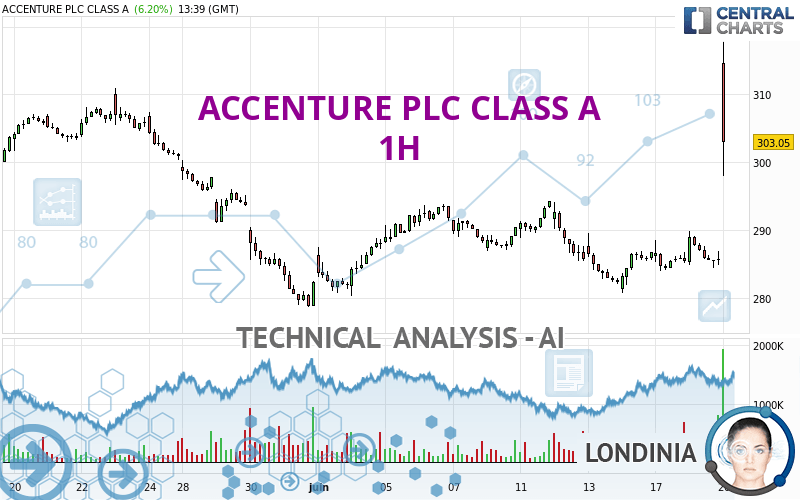
ACCENTURE PLC CLASS A - 1H - Technical analysis published on 06/20/2024 (GMT)
- 72
- 0
Click here for a new analysis!
- Timeframe : 1H
- - Analysis generated on
- Status : TARGET REACHED
Summary of the analysis

Additional analysis
Quotes
The ACCENTURE PLC CLASS A rating is 305.50 USD. On the day, this instrument gained +7.06% and was traded between 303.29 USD and 317.73 USD over the period. The price is currently at +0.73% from its lowest and -3.85% from its highest.The Central Gaps scanner detects a bullish opening. A small advantage for buyers in the very short term.
Bullish opening
Type : Bullish
Timeframe : Openning
A study of price movements over other periods shows the following variations:
Near a new LOW record (1 year)
Type : Bearish
Timeframe : Weekly
Near a new LOW record (1st january)
Type : Bearish
Timeframe : Weekly
Near a new LOW record (1 month)
Type : Bearish
Timeframe : Weekly
Technical
Technical analysis of ACCENTURE PLC CLASS A in 1H shows an overall bullish trend. 78.57% of the signals given by moving averages are bullish. The overall trend is reinforced by the strong bullish signals from short-term moving averages. The Central Indicators scanner detects bullish signals on moving averages that could impact this trend:
Moving Average bullish crossovers : AMA20 & AMA50
Type : Bullish
Timeframe : 1 hour
Bullish price crossover with Moving Average 20
Type : Bullish
Timeframe : 1 hour
Bullish price crossover with Moving Average 50
Type : Bullish
Timeframe : 1 hour
Bullish price crossover with Moving Average 100
Type : Bullish
Timeframe : 1 hour
Bullish price crossover with adaptative moving average 20
Type : Bullish
Timeframe : 1 hour
Bullish price crossover with adaptative moving average 50
Type : Bullish
Timeframe : 1 hour
Bullish price crossover with adaptative moving average 100
Type : Bullish
Timeframe : 1 hour
The probability of a further increase is high given the direction of the technical indicators.
Caution: the Central Indicators scanner currently detects an excess:
CCI indicator is overbought : over 100
Type : Neutral
Timeframe : 1 hour
MACD indicator: bullish divergence
Type : Bullish
Timeframe : 1 hour
Pivot points : price is over resistance 3
Type : Neutral
Timeframe : 1 hour
Ichimoku : price is over the cloud
Type : Bullish
Timeframe : 1 hour
MACD indicator is back over 0
Type : Bullish
Timeframe : 1 hour
Momentum indicator is back over 0
Type : Bullish
Timeframe : 1 hour
An analysis of the price chart with the Central Patterns scanner (detector of chart patterns and resistances and supports) shows several results that can have an impact on the price change:
Near horizontal support
Type : Bullish
Timeframe : 1 hour
Near support of channel
Type : Bullish
Timeframe : 1 hour
Central Candlesticks, the scanner specialised in Japanese candlesticks, detects a bearish signal that could support the hypothesis of a small drop in the very short term:
Long black line
Type : Bearish
Timeframe : 1 hour
| S3 | S2 | S1 | Price | R1 | R2 | R3 | |
|---|---|---|---|---|---|---|---|
| ProTrendLines | 284.83 | 294.16 | 298.24 | 305.50 | 310.99 | 320.11 | 333.90 |
| Change (%) | -6.77% | -3.71% | -2.38% | - | +1.80% | +4.78% | +9.30% |
| Change | -20.67 | -11.34 | -7.26 | - | +5.49 | +14.61 | +28.40 |
| Level | Intermediate | Intermediate | Major | - | Minor | Minor | Minor |
To determine price objectives, it is also possible to use the pivot points. Here is the price position in relation to pivot points:
| Pivot points | S3 | S2 | S1 | PP | R1 | R2 | R3 |
|---|---|---|---|---|---|---|---|
| Standard | 277.67 | 281.03 | 283.19 | 286.55 | 288.71 | 292.07 | 294.23 |
| Camarilla | 283.83 | 284.34 | 284.84 | 285.35 | 285.86 | 286.36 | 286.87 |
| Woodie | 277.07 | 280.73 | 282.59 | 286.25 | 288.11 | 291.77 | 293.63 |
| Fibonacci | 281.03 | 283.14 | 284.44 | 286.55 | 288.66 | 289.96 | 292.07 |
| Pivot points | S3 | S2 | S1 | PP | R1 | R2 | R3 |
|---|---|---|---|---|---|---|---|
| Standard | 266.58 | 273.64 | 280.18 | 287.24 | 293.78 | 300.84 | 307.38 |
| Camarilla | 282.97 | 284.22 | 285.46 | 286.71 | 287.96 | 289.20 | 290.45 |
| Woodie | 266.31 | 273.51 | 279.91 | 287.11 | 293.51 | 300.71 | 307.11 |
| Fibonacci | 273.64 | 278.84 | 282.05 | 287.24 | 292.44 | 295.65 | 300.84 |
| Pivot points | S3 | S2 | S1 | PP | R1 | R2 | R3 |
|---|---|---|---|---|---|---|---|
| Standard | 234.81 | 256.75 | 269.52 | 291.46 | 304.23 | 326.17 | 338.94 |
| Camarilla | 272.75 | 275.93 | 279.11 | 282.29 | 285.47 | 288.65 | 291.84 |
| Woodie | 230.23 | 254.46 | 264.94 | 289.17 | 299.65 | 323.88 | 334.36 |
| Fibonacci | 256.75 | 270.01 | 278.20 | 291.46 | 304.72 | 312.91 | 326.17 |
Numerical data
The following is the status of technical indicators and moving averages registered at the time this technical analysis was created:
| RSI (14): | 81.13 | |
| MACD (12,26,9): | 1.2800 | |
| Directional Movement: | 57.75 | |
| AROON (14): | 92.86 | |
| DEMA (21): | 289.61 | |
| Parabolic SAR (0,02-0,02-0,2): | 284.39 | |
| Elder Ray (13): | 21.62 | |
| Super Trend (3,10): | 296.24 | |
| Zig ZAG (10): | 305.90 | |
| VORTEX (21): | 1.0700 | |
| Stochastique (14,3,5): | 41.75 | |
| TEMA (21): | 291.25 | |
| Williams %R (14): | -32.65 | |
| Chande Momentum Oscillator (20): | 22.31 | |
| Repulse (5,40,3): | -3.6800 | |
| ROCnROLL: | 1 | |
| TRIX (15,9): | 0.0000 | |
| Courbe Coppock: | 2.89 |
| MA7: | 289.20 | |
| MA20: | 291.49 | |
| MA50: | 302.52 | |
| MA100: | 332.54 | |
| MAexp7: | 290.67 | |
| MAexp20: | 287.98 | |
| MAexp50: | 287.73 | |
| MAexp100: | 289.58 | |
| Price / MA7: | +5.64% | |
| Price / MA20: | +4.81% | |
| Price / MA50: | +0.99% | |
| Price / MA100: | -8.13% | |
| Price / MAexp7: | +5.10% | |
| Price / MAexp20: | +6.08% | |
| Price / MAexp50: | +6.18% | |
| Price / MAexp100: | +5.50% |
News
Don't forget to follow the news on ACCENTURE PLC CLASS A. At the time of publication of this analysis, the latest news was as follows:
- Palo Alto Networks and Accenture Team to Secure the GenAI Transformation Journey
- BNY Mellon Collaborates with Accenture to Drive Accelerated Growth for Clients
- Best Buy, Google Cloud, and Accenture Partner to Create a Better Customer Support Experience with Generative AI
- Accenture and Google Cloud Launch Joint Generative AI Center of Excellence to Help Enterprises Harness the Value of Generative AI
- Stagwell (STGW) Completes Divestment of ConcentricLife to Accenture for $245 Million
About author
Online


Add a comment
Comments
0 comments on the analysis ACCENTURE PLC CLASS A - 1H