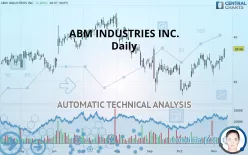
ABM INDUSTRIES INC. - Daily - Technical analysis published on 11/12/2019 (GMT)
- 363
- 0
- Who voted?
Click here for a new analysis!
- Timeframe : Daily
- - Analysis generated on
- Status : INVALID

Summary of the analysis

Additional analysis
Quotes
The ABM INDUSTRIES INC. price is 38.66 USD. The price registered an increase of +2.60% on the session with the lowest point at 37.59 USD and the highest point at 38.71 USD. The deviation from the price is +2.85% for the low point and -0.13% for the high point.The Central Gaps scanner detects a bullish opening. A small advantage for buyers in the very short term.
Bullish opening
Type : Bullish
Timeframe : Openning
Here is a more detailed summary of the historical variations registered by ABM INDUSTRIES INC.:
Technical
Technical analysis of this Daily chart of ABM INDUSTRIES INC. indicates that the overall trend is bullish. The signals returned by the moving averages are 71.43% bullish. This bullish trend is reinforced by the strong signals currently being given by short-term moving averages. The Central Indicators scanner does not detect any result on moving averages that would impact this trend.
An assessment of technical indicators shows a strong bullish signal.
Caution: the Central Indicators scanner currently detects an excess:
RSI indicator: bearish divergence
Type : Bearish
Timeframe : Daily
Williams %R indicator is overbought : over -20
Type : Neutral
Timeframe : Daily
Pivot points : price is over resistance 1
Type : Neutral
Timeframe : Weekly
Pivot points : price is over resistance 2
Type : Neutral
Timeframe : Daily
An analysis of the price chart with the Central Patterns scanner (detector of chart patterns and resistances and supports) shows a result that can have an impact on the price change:
Near resistance of channel
Type : Bearish
Timeframe : Daily
No result was found by the Central Candlesticks scanner on Japanese candlesticks.
| S3 | S2 | S1 | Price | R1 | R2 | R3 | |
|---|---|---|---|---|---|---|---|
| ProTrendLines | 34.99 | 36.50 | 37.89 | 38.66 | 39.41 | 41.07 | 42.25 |
| Change (%) | -9.49% | -5.59% | -1.99% | - | +1.94% | +6.23% | +9.29% |
| Change | -3.67 | -2.16 | -0.77 | - | +0.75 | +2.41 | +3.59 |
| Level | Major | Major | Major | - | Intermediate | Minor | Intermediate |
Attention could also be paid to pivot points to set price objectives:
| Pivot points | S3 | S2 | S1 | PP | R1 | R2 | R3 |
|---|---|---|---|---|---|---|---|
| Standard | 36.72 | 36.99 | 37.33 | 37.60 | 37.94 | 38.21 | 38.55 |
| Camarilla | 37.51 | 37.57 | 37.62 | 37.68 | 37.74 | 37.79 | 37.85 |
| Woodie | 36.77 | 37.01 | 37.38 | 37.62 | 37.99 | 38.23 | 38.60 |
| Fibonacci | 36.99 | 37.22 | 37.36 | 37.60 | 37.83 | 37.97 | 38.21 |
| Pivot points | S3 | S2 | S1 | PP | R1 | R2 | R3 |
|---|---|---|---|---|---|---|---|
| Standard | 35.13 | 35.72 | 36.76 | 37.35 | 38.39 | 38.98 | 40.02 |
| Camarilla | 37.36 | 37.51 | 37.66 | 37.81 | 37.96 | 38.11 | 38.26 |
| Woodie | 35.37 | 35.83 | 37.00 | 37.46 | 38.63 | 39.09 | 40.26 |
| Fibonacci | 35.72 | 36.34 | 36.72 | 37.35 | 37.97 | 38.35 | 38.98 |
| Pivot points | S3 | S2 | S1 | PP | R1 | R2 | R3 |
|---|---|---|---|---|---|---|---|
| Standard | 29.19 | 31.32 | 33.89 | 36.03 | 38.60 | 40.73 | 43.30 |
| Camarilla | 35.17 | 35.60 | 36.03 | 36.46 | 36.89 | 37.32 | 37.75 |
| Woodie | 29.40 | 31.43 | 34.11 | 36.13 | 38.81 | 40.84 | 43.52 |
| Fibonacci | 31.32 | 33.12 | 34.23 | 36.03 | 37.82 | 38.93 | 40.73 |
Numerical data
The following are the details of the technical indicators and moving averages that were collected to generate this technical analysis:
| RSI (14): | 64.89 | |
| MACD (12,26,9): | 0.3900 | |
| Directional Movement: | 2.43 | |
| AROON (14): | 50.00 | |
| DEMA (21): | 37.64 | |
| Parabolic SAR (0,02-0,02-0,2): | 35.90 | |
| Elder Ray (13): | 0.74 | |
| Super Trend (3,10): | 35.61 | |
| Zig ZAG (10): | 38.49 | |
| VORTEX (21): | 1.0900 | |
| Stochastique (14,3,5): | 86.32 | |
| TEMA (21): | 37.98 | |
| Williams %R (14): | -5.84 | |
| Chande Momentum Oscillator (20): | 1.11 | |
| Repulse (5,40,3): | 4.4000 | |
| ROCnROLL: | 1 | |
| TRIX (15,9): | 0.1300 | |
| Courbe Coppock: | 1.20 |
| MA7: | 37.54 | |
| MA20: | 37.32 | |
| MA50: | 36.37 | |
| MA100: | 37.99 | |
| MAexp7: | 37.69 | |
| MAexp20: | 37.18 | |
| MAexp50: | 37.01 | |
| MAexp100: | 37.16 | |
| Price / MA7: | +2.98% | |
| Price / MA20: | +3.59% | |
| Price / MA50: | +6.30% | |
| Price / MA100: | +1.76% | |
| Price / MAexp7: | +2.57% | |
| Price / MAexp20: | +3.98% | |
| Price / MAexp50: | +4.46% | |
| Price / MAexp100: | +4.04% |
News
The last news published on ABM INDUSTRIES INC. at the time of the generation of this analysis was as follows:
- Recent Analysis Shows Amerco, McKesson, Ophthotech, IQVIA, Highwoods Properties, and ABM Industries Market Influences — Renewed Outlook, Key Drivers of Growth
- Faruqi & Faruqi, LLP is Investigating ABM Industries Inc. (ABM) on Behalf of its Shareholders
- Investor Network: ABM Industries Incorporated to Host Earnings Call
-
 ABM Industries
- ABM and Heller Machine Tools Secure Largest PACE Investment in Michigan
About author

Online


Add a comment
Comments
0 comments on the analysis ABM INDUSTRIES INC. - Daily