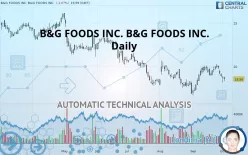
B&G FOODS INC. - Daily - Technical analysis published on 10/02/2019 (GMT)
- 305
- 0
- Who voted?
Click here for a new analysis!
- Timeframe : Daily
- - Analysis generated on
- Status : TARGET REACHED

Summary of the analysis

Additional analysis
Quotes
The B&G FOODS INC. B&G FOODS INC. price is 18.56 USD. The price registered a decrease of -1.07% on the session and was between 18.30 USD and 18.79 USD. This implies that the price is at +1.42% from its lowest and at -1.22% from its highest.A bearish opening was detected by the Central Gaps scanner. Sellers are trying to impose a bearish trend in the very short term.
Bearish opening
Type : Bearish
Timeframe : Openning
A study of price movements over other periods shows the following variations:
Technical
Technical analysis of this Daily chart of B&G FOODS INC. B&G FOODS INC. indicates that the overall trend is bearish. 71.43% of the signals given by moving averages are bearish. Caution: the neutral signals currently given by short-term moving averages show us that the global trend is losing momentum. The Central Indicators market scanner is currently detecting several bearish signals that could impact this trend:
Bearish trend reversal : adaptative moving average 20
Type : Bearish
Timeframe : Daily
Bearish trend reversal : adaptative moving average 50
Type : Bearish
Timeframe : Daily
Bearish price crossover with Moving Average 20
Type : Bearish
Timeframe : Daily
In fact, Central Analyzer took into account 18 technical indicators and the result was as follows: 5 are bullish, 6 are neutral and 7 are bearish. Central Indicators, the scanner specialised in technical indicators, has identified these signals:
RSI indicator is back under 50
Type : Bearish
Timeframe : Daily
MACD crosses DOWN its Moving Average
Type : Bearish
Timeframe : Daily
Price is back under the pivot point
Type : Bearish
Timeframe : Weekly
The analysis of the price chart with Central Patterns scanners does not return any result.
There is also a Japanese candlestick pattern detected by Central Candlesticks that could mark the end of the current short-term trend:
Doji
Type : Neutral
Timeframe : Daily
| S3 | S2 | S1 | Price | R1 | R2 | R3 | |
|---|---|---|---|---|---|---|---|
| ProTrendLines | 11.64 | 16.00 | 17.91 | 18.56 | 20.00 | 22.15 | 23.52 |
| Change (%) | -37.28% | -13.79% | -3.50% | - | +7.76% | +19.34% | +26.72% |
| Change | -6.92 | -2.56 | -0.65 | - | +1.44 | +3.59 | +4.96 |
| Level | Intermediate | Major | Intermediate | - | Major | Minor | Minor |
To determine price objectives, it is also possible to use the pivot points. Here is the price position in relation to pivot points:
| Pivot points | S3 | S2 | S1 | PP | R1 | R2 | R3 |
|---|---|---|---|---|---|---|---|
| Standard | 17.51 | 17.81 | 18.29 | 18.59 | 19.07 | 19.37 | 19.85 |
| Camarilla | 18.55 | 18.62 | 18.69 | 18.76 | 18.83 | 18.90 | 18.97 |
| Woodie | 17.59 | 17.86 | 18.37 | 18.64 | 19.15 | 19.42 | 19.93 |
| Fibonacci | 17.81 | 18.11 | 18.30 | 18.59 | 18.89 | 19.08 | 19.37 |
| Pivot points | S3 | S2 | S1 | PP | R1 | R2 | R3 |
|---|---|---|---|---|---|---|---|
| Standard | 17.12 | 17.87 | 18.29 | 19.04 | 19.47 | 20.21 | 20.64 |
| Camarilla | 18.40 | 18.50 | 18.61 | 18.72 | 18.82 | 18.93 | 19.04 |
| Woodie | 16.96 | 17.79 | 18.13 | 18.96 | 19.30 | 20.13 | 20.47 |
| Fibonacci | 17.87 | 18.32 | 18.60 | 19.04 | 19.49 | 19.77 | 20.21 |
| Pivot points | S3 | S2 | S1 | PP | R1 | R2 | R3 |
|---|---|---|---|---|---|---|---|
| Standard | 13.38 | 14.84 | 16.87 | 18.33 | 20.37 | 21.83 | 23.86 |
| Camarilla | 17.95 | 18.27 | 18.59 | 18.91 | 19.23 | 19.55 | 19.87 |
| Woodie | 13.67 | 14.98 | 17.16 | 18.48 | 20.66 | 21.97 | 24.15 |
| Fibonacci | 14.84 | 16.17 | 17.00 | 18.33 | 19.67 | 20.49 | 21.83 |
Numerical data
The following are the details of the technical indicators and moving averages that were collected to generate this technical analysis:
| RSI (14): | 47.09 | |
| MACD (12,26,9): | 0.1600 | |
| Directional Movement: | -3.79 | |
| AROON (14): | -28.57 | |
| DEMA (21): | 19.04 | |
| Parabolic SAR (0,02-0,02-0,2): | 19.70 | |
| Elder Ray (13): | -0.38 | |
| Super Trend (3,10): | 17.73 | |
| Zig ZAG (10): | 18.56 | |
| VORTEX (21): | 1.1500 | |
| Stochastique (14,3,5): | 32.91 | |
| TEMA (21): | 19.22 | |
| Williams %R (14): | -73.65 | |
| Chande Momentum Oscillator (20): | -0.76 | |
| Repulse (5,40,3): | -0.5500 | |
| ROCnROLL: | 2 | |
| TRIX (15,9): | 0.1800 | |
| Courbe Coppock: | 3.87 |
| MA7: | 19.11 | |
| MA20: | 18.93 | |
| MA50: | 18.42 | |
| MA100: | 19.61 | |
| MAexp7: | 18.92 | |
| MAexp20: | 18.83 | |
| MAexp50: | 18.88 | |
| MAexp100: | 19.71 | |
| Price / MA7: | -2.88% | |
| Price / MA20: | -1.95% | |
| Price / MA50: | +0.76% | |
| Price / MA100: | -5.35% | |
| Price / MAexp7: | -1.90% | |
| Price / MAexp20: | -1.43% | |
| Price / MAexp50: | -1.69% | |
| Price / MAexp100: | -5.83% |
News
Don"t forget to follow the news on B&G FOODS INC. B&G FOODS INC.. At the time of publication of this analysis, the latest news was as follows:
- B&G Foods Closes $550.0 Million Public Offering of Senior Notes
- B&G Foods Announces Pricing of Term Loan B Facility
- B&G Foods Announces Pricing and Upsizing of Public Offering of Senior Notes
- B&G Foods Announces Public Offering of Senior Notes
- B&G Foods Announces Proposed Refinancing
About author

Online


Add a comment
Comments
0 comments on the analysis B&G FOODS INC. - Daily