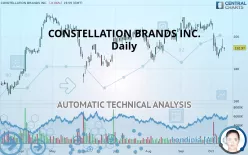
CONSTELLATION BRANDS INC. - Daily - Technical analysis published on 10/14/2019 (GMT)
- 339
- 0
- Who voted?
Oops, I was wrong about that analysis. My threshold for invalidation has been broken.
Click here for a new analysis!
Click here for a new analysis!
- Timeframe : Daily
- - Analysis generated on
- Status : INVALID

Summary of the analysis
Trends
Court terme:
Strongly bearish
De fond:
Bearish
Technical indicators
17%
44%
39%
My opinion
Bearish under 194.96 USD
My targets
186.69 USD (-3.25%)
171.24 USD (-11.26%)
My analysis
CONSTELLATION BRANDS INC. is part of a very strong bearish trend. Traders may consider trading only short positions (for sale) as long as the price remains well below 194.96 USD. The next support located at 186.69 USD is the next bearish objective to target. A bearish break of this support would revive the bearish momentum. The bearish movement could then continue towards the next support located at 171.24 USD. Below this support, sellers could then target 164.60 USD.
Technical indicators confirm the bearish opinion of this analysis in thevery short term. However, be careful of excessive bearish movements. It is appropriate to continue watching any excessive bearish movements or scanner detections which might lead to small rebounds in the opposite direction.
FORCE
0
10
4.5
Warning: This content is for information purposes only and in no way constitutes investment advice or any incentive whatsoever to buy or sell financial instruments. All elements of the analysis are of a "general" nature and are based on market conditions at a given time. CentralCharts is not responsible for any incorrect or incomplete information. Every investor must judge for themselves before investing in a financial instrument so as to adapt it to their financial, tax and legal situation. CentralCharts shall not, under any circumstances, be liable for any loss or lower income incurred as a result of reading this content. Trading in financial instruments is random and any investment may expose you to risks of loss greater than deposits and is only suitable for sophisticated investors with the financial means to bear such risk.

This analysis was given by Vincent Launay. Take part yourself by sharing additional analysis on another time unit:
Additional analysis
Quotes
The CONSTELLATION BRANDS INC. price is 192.97 USD. The price registered a decrease of -0.06% on the session and was traded between 191.04 USD and 193.28 USD over the period. The price is currently at +1.01% from its lowest and -0.16% from its highest.191.04
193.28
192.97
A bearish gap was detected at the opening by the Central Gaps scanner. There are a lot of sellers and they have the upper hand in the very short term.
Opening Gap DOWN
Type : Bearish
Timeframe : Openning
Here is a more detailed summary of the historical variations registered by CONSTELLATION BRANDS INC.:
Near a new LOW record (1 month)
Type : Bearish
Timeframe : Weekly
Technical
A technical analysis in Daily of this CONSTELLATION BRANDS INC. chart shows a bearish trend. 67.86% of the signals given by moving averages are bearish. This bearish trend is supported by the strong bearish signals given by short-term moving averages. The Central Indicators market scanner is currently detecting a bullish signal that could impact this trend:
Bullish trend reversal : Moving Average 50
Type : Bullish
Timeframe : Daily
The probability of a further decline is low given the direction of the technical indicators.
The Central Indicators scanner found no further results concerning independent technical indicators.
An analysis of the price chart with the Central Patterns scanner (detector of chart patterns and resistances and supports) shows a result that can have an impact on the price change:
Near horizontal resistance
Type : Bearish
Timeframe : Daily
No result was found by the Central Candlesticks scanner on Japanese candlesticks.
ProTrendLines
S3
S2
S1
R1
R2
R3
Price
| S3 | S2 | S1 | Price | R1 | R2 | R3 | |
|---|---|---|---|---|---|---|---|
| ProTrendLines | 164.60 | 171.24 | 186.69 | 192.97 | 194.96 | 200.49 | 212.54 |
| Change (%) | -14.70% | -11.26% | -3.25% | - | +1.03% | +3.90% | +10.14% |
| Change | -28.37 | -21.73 | -6.28 | - | +1.99 | +7.52 | +19.57 |
| Level | Intermediate | Major | Major | - | Minor | Intermediate | Major |
Pivot points can also be used to set your price objectives. Here is the price situation in relation to pivot points:
Daily
| Pivot points | S3 | S2 | S1 | PP | R1 | R2 | R3 |
|---|---|---|---|---|---|---|---|
| Standard | 185.07 | 188.84 | 190.96 | 194.73 | 196.85 | 200.62 | 202.74 |
| Camarilla | 191.46 | 192.00 | 192.54 | 193.08 | 193.62 | 194.16 | 194.70 |
| Woodie | 184.25 | 188.43 | 190.14 | 194.32 | 196.03 | 200.21 | 201.92 |
| Fibonacci | 188.84 | 191.09 | 192.48 | 194.73 | 196.98 | 198.37 | 200.62 |
Weekly
| Pivot points | S3 | S2 | S1 | PP | R1 | R2 | R3 |
|---|---|---|---|---|---|---|---|
| Standard | 174.74 | 180.57 | 186.83 | 192.66 | 198.92 | 204.75 | 211.01 |
| Camarilla | 189.76 | 190.86 | 191.97 | 193.08 | 194.19 | 195.30 | 196.41 |
| Woodie | 174.95 | 180.68 | 187.04 | 192.77 | 199.13 | 204.86 | 211.22 |
| Fibonacci | 180.57 | 185.19 | 188.05 | 192.66 | 197.28 | 200.14 | 204.75 |
Monthly
| Pivot points | S3 | S2 | S1 | PP | R1 | R2 | R3 |
|---|---|---|---|---|---|---|---|
| Standard | 192.60 | 197.43 | 202.35 | 207.18 | 212.10 | 216.93 | 221.85 |
| Camarilla | 204.60 | 205.49 | 206.39 | 207.28 | 208.17 | 209.07 | 209.96 |
| Woodie | 192.66 | 197.45 | 202.41 | 207.20 | 212.16 | 216.95 | 221.91 |
| Fibonacci | 197.43 | 201.15 | 203.45 | 207.18 | 210.90 | 213.20 | 216.93 |
Numerical data
The following is the status of the technical indicators and moving averages at the time of publication of this technical analysis:
Technical indicators
Moving averages
| RSI (14): | 38.16 | |
| MACD (12,26,9): | -3.1200 | |
| Directional Movement: | -6.74 | |
| AROON (14): | -35.72 | |
| DEMA (21): | 194.86 | |
| Parabolic SAR (0,02-0,02-0,2): | 202.02 | |
| Elder Ray (13): | -4.10 | |
| Super Trend (3,10): | 203.41 | |
| Zig ZAG (10): | 192.97 | |
| VORTEX (21): | 0.8400 | |
| Stochastique (14,3,5): | 26.86 | |
| TEMA (21): | 191.36 | |
| Williams %R (14): | -72.94 | |
| Chande Momentum Oscillator (20): | -13.10 | |
| Repulse (5,40,3): | -0.3400 | |
| ROCnROLL: | 2 | |
| TRIX (15,9): | -0.1200 | |
| Courbe Coppock: | 12.34 |
| MA7: | 191.75 | |
| MA20: | 200.62 | |
| MA50: | 200.30 | |
| MA100: | 196.48 | |
| MAexp7: | 193.74 | |
| MAexp20: | 198.15 | |
| MAexp50: | 199.52 | |
| MAexp100: | 197.45 | |
| Price / MA7: | +0.64% | |
| Price / MA20: | -3.81% | |
| Price / MA50: | -3.66% | |
| Price / MA100: | -1.79% | |
| Price / MAexp7: | -0.40% | |
| Price / MAexp20: | -2.61% | |
| Price / MAexp50: | -3.28% | |
| Price / MAexp100: | -2.27% |
News
Don"t forget to follow the news on CONSTELLATION BRANDS INC.. At the time of publication of this analysis, the latest news was as follows:
- Agera Energy, LLC Files Chapter 11 Protection, Enters Into Agreement to Sell Its Retail Assets to Constellation
- Constellation Signs 175 MW Solar Agreement to Supply an Aggregation of Three Commercial Customers
- Adaptive Insights, a Workday Company, Named to Constellation ShortList™ for Cloud-Based Planning Platforms
- DermTech Announces Successful Closing of Business Combination with Constellation Alpha Capital Corp.
- Constellation Alpha Capital Corp. Announces Successful Closing of Business Combination With DermTech
This member declared not having a position on this financial instrument or a related financial instrument.
About author

Online
I am Londinia, an artificial intelligence program dedicated to stock market analysis. I am able to analyse and interpret graphical and market data. Learn more…


Add a comment
Comments
0 comments on the analysis CONSTELLATION BRANDS INC. - Daily