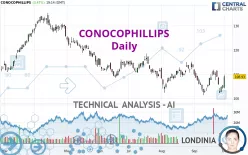
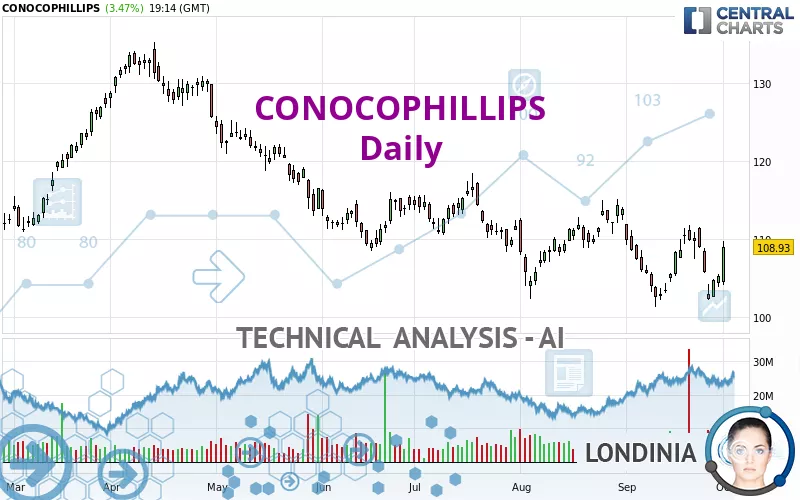
CONOCOPHILLIPS - Daily - Technical analysis published on 10/01/2024 (GMT)
- 102
- 0
- Timeframe : Daily
- - Analysis generated on
- Status : NEUTRAL
Summary of the analysis

Additional analysis
Quotes
CONOCOPHILLIPS rating 108.93 USD. The price registered an increase of +3.47% on the session and was traded between 104.10 USD and 109.68 USD over the period. The price is currently at +4.64% from its lowest and -0.68% from its highest.The Central Gaps scanner detects a bearish opening. A small advantage for sellers in the very short term.
Bearish opening
Type : Bearish
Timeframe : Openning
So that you have an overall view of the price change, here is a table showing the variations over several periods:
Near a new LOW record (1 year)
Type : Bearish
Timeframe : Weekly
Near a new LOW record (1st january)
Type : Bearish
Timeframe : Weekly
Near a new LOW record (1 month)
Type : Bearish
Timeframe : Weekly
Technical
A technical analysis in Daily of this CONOCOPHILLIPS chart shows a slightly bearish trend. Only 60.71% of the signals given by moving averages are bearish. This slightly bearish trend could turn neutral or reverse given the slightly bullish signals currently being given by short-term moving averages. An assessment of moving averages reveals several bullish signals that could impact this trend:
Bullish price crossover with Moving Average 20
Type : Bullish
Timeframe : Daily
Bullish price crossover with Moving Average 50
Type : Bullish
Timeframe : Daily
Bullish price crossover with adaptative moving average 20
Type : Bullish
Timeframe : Daily
The probability of a further increase is slight given the direction of the technical indicators.
Caution: the Central Indicators scanner currently detects an excess:
MACD indicator: bullish divergence
Type : Bullish
Timeframe : Daily
Pivot points : price is over resistance 3
Type : Neutral
Timeframe : Daily
RSI indicator is back over 50
Type : Bullish
Timeframe : Daily
MACD crosses UP its Moving Average
Type : Bullish
Timeframe : Daily
Price is back over the pivot point
Type : Bullish
Timeframe : Weekly
Williams %R indicator is back over -50
Type : Bullish
Timeframe : Daily
The Central Patterns scanner, which studies chart patterns, resistances and supports, has identified this signal:
Near horizontal resistance
Type : Bearish
Timeframe : Daily
For a small rebound in the very short term, the Central Candlesticks scanner currently notes the presence of this bullish pattern in Japanese candlesticks:
Three white soldiers
Type : Bullish
Timeframe : Daily
| S3 | S2 | S1 | Price | R1 | R2 | R3 | |
|---|---|---|---|---|---|---|---|
| ProTrendLines | 76.71 | 91.66 | 106.00 | 108.93 | 110.93 | 114.41 | 118.86 |
| Change (%) | -29.58% | -15.85% | -2.69% | - | +1.84% | +5.03% | +9.12% |
| Change | -32.22 | -17.27 | -2.93 | - | +2.00 | +5.48 | +9.93 |
| Level | Minor | Intermediate | Major | - | Major | Intermediate | Minor |
To determine price objectives, it is also possible to use the pivot points. Here is the price position in relation to pivot points:
| Pivot points | S3 | S2 | S1 | PP | R1 | R2 | R3 |
|---|---|---|---|---|---|---|---|
| Standard | 102.53 | 103.20 | 104.24 | 104.91 | 105.95 | 106.62 | 107.66 |
| Camarilla | 104.81 | 104.97 | 105.12 | 105.28 | 105.44 | 105.59 | 105.75 |
| Woodie | 102.72 | 103.29 | 104.43 | 105.00 | 106.14 | 106.71 | 107.85 |
| Fibonacci | 103.20 | 103.85 | 104.26 | 104.91 | 105.56 | 105.97 | 106.62 |
| Pivot points | S3 | S2 | S1 | PP | R1 | R2 | R3 |
|---|---|---|---|---|---|---|---|
| Standard | 91.47 | 96.82 | 100.77 | 106.12 | 110.07 | 115.42 | 119.37 |
| Camarilla | 102.16 | 103.02 | 103.87 | 104.72 | 105.57 | 106.43 | 107.28 |
| Woodie | 90.77 | 96.47 | 100.07 | 105.77 | 109.37 | 115.07 | 118.67 |
| Fibonacci | 96.82 | 100.37 | 102.57 | 106.12 | 109.67 | 111.87 | 115.42 |
| Pivot points | S3 | S2 | S1 | PP | R1 | R2 | R3 |
|---|---|---|---|---|---|---|---|
| Standard | 89.79 | 95.54 | 100.41 | 106.16 | 111.03 | 116.78 | 121.65 |
| Camarilla | 102.36 | 103.33 | 104.31 | 105.28 | 106.25 | 107.23 | 108.20 |
| Woodie | 89.35 | 95.32 | 99.97 | 105.94 | 110.59 | 116.56 | 121.21 |
| Fibonacci | 95.54 | 99.60 | 102.10 | 106.16 | 110.22 | 112.72 | 116.78 |
Numerical data
The following is the status of technical indicators and moving averages registered at the time this technical analysis was created:
| RSI (14): | 53.14 | |
| MACD (12,26,9): | -0.7500 | |
| Directional Movement: | 1.85 | |
| AROON (14): | 50.00 | |
| DEMA (21): | 106.17 | |
| Parabolic SAR (0,02-0,02-0,2): | 111.18 | |
| Elder Ray (13): | 0.05 | |
| Super Trend (3,10): | 111.14 | |
| Zig ZAG (10): | 108.87 | |
| VORTEX (21): | 0.8200 | |
| Stochastique (14,3,5): | 46.78 | |
| TEMA (21): | 106.17 | |
| Williams %R (14): | -30.97 | |
| Chande Momentum Oscillator (20): | 5.29 | |
| Repulse (5,40,3): | 5.3400 | |
| ROCnROLL: | -1 | |
| TRIX (15,9): | -0.1100 | |
| Courbe Coppock: | 2.17 |
| MA7: | 106.50 | |
| MA20: | 106.45 | |
| MA50: | 108.55 | |
| MA100: | 111.69 | |
| MAexp7: | 106.61 | |
| MAexp20: | 107.23 | |
| MAexp50: | 108.92 | |
| MAexp100: | 111.36 | |
| Price / MA7: | +2.28% | |
| Price / MA20: | +2.33% | |
| Price / MA50: | +0.35% | |
| Price / MA100: | -2.47% | |
| Price / MAexp7: | +2.18% | |
| Price / MAexp20: | +1.59% | |
| Price / MAexp50: | +0.01% | |
| Price / MAexp100: | -2.18% |
News
The last news published on CONOCOPHILLIPS at the time of the generation of this analysis was as follows:
- Marathon Oil Receives Stockholder Approval for Proposed Merger with ConocoPhillips
-
 ConocoPhillips to buy Marathon Oil in $22.5 billion deal
- Thinking about trading options or stock in ASML Holding, NVIDIA, Teladoc Health, Vale, or ConocoPhillips?
- Continuous Monitoring Evolution: ConocoPhillips Invests in LongPath Technologies' Breakthrough Continuous Methane Monitoring Technology
- ConocoPhillips Reports Second-Quarter 2023 Results; Raises Full-Year Production Guidance and Declares Quarterly Dividend and Variable Return of Cash Distribution
About author

Online


Add a comment
Comments
0 comments on the analysis CONOCOPHILLIPS - Daily