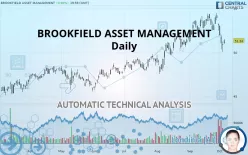
BROOKFIELD ASSET MANAGEMENT - Daily - Technical analysis published on 10/07/2019 (GMT)
- 332
- 0
- Who voted?
Click here for a new analysis!
- Timeframe : Daily
- - Analysis generated on
- Status : INVALID

Summary of the analysis
Additional analysis
Quotes
The BROOKFIELD ASSET MANAGEMENT price is 51.34 USD. The price has increased by +0.98% since the last closing and was between 50.98 USD and 51.50 USD. This implies that the price is at +0.71% from its lowest and at -0.31% from its highest.A bullish opening was detected by the Central Gaps scanner. Buyers are trying to impose a bullish momentum in the very short term.
Bullish opening
Type : Bullish
Timeframe : Openning
Here is a more detailed summary of the historical variations registered by BROOKFIELD ASSET MANAGEMENT:
Near a new HIGH record (5 years)
Type : Bullish
Timeframe : Weekly
Near a new LOW record (1 month)
Type : Bearish
Timeframe : Weekly
The Central Volumes scanner notes the presence of abnormal volumes:
Abnormal volumes
Timeframe : 5 days
Technical
Technical analysis of this Daily chart of BROOKFIELD ASSET MANAGEMENT indicates that the overall trend is slightly bullish. 57.14% of the signals given by moving averages are bullish. Caution: the strong bearish signals currently being given by short-term moving averages indicate that this slightly bullish trend could be reversed. The Central Indicators market scanner currently does not detect any result that concerns moving averages.
In fact, according to the parameters integrated into the Central Analyzer system, 11 technical indicators out of 18 analysed are currently bearish. Caution: the Central Indicators scanner currently detects an excess:
CCI indicator is oversold : under -100
Type : Neutral
Timeframe : Daily
Previous candle closed under Bollinger bands
Type : Neutral
Timeframe : Daily
Williams %R indicator is oversold : under -80
Type : Neutral
Timeframe : Daily
Pivot points : price is under support 3
Type : Neutral
Timeframe : Weekly
Central Patterns, the market scanner focusing on chart patterns, resistances and supports found this result:
Near support of channel
Type : Bullish
Timeframe : Daily
The Central Candlesticks scanner, specialised in Japanese candlesticks, did not identify any signals.
| S3 | S2 | S1 | Price | R1 | R2 | |
|---|---|---|---|---|---|---|
| ProTrendLines | 44.01 | 45.84 | 48.24 | 51.34 | 52.66 | 54.13 |
| Change (%) | -14.28% | -10.71% | -6.04% | - | +2.57% | +5.43% |
| Change | -7.33 | -5.50 | -3.10 | - | +1.32 | +2.79 |
| Level | Intermediate | Intermediate | Major | - | Intermediate | Major |
Attention could also be paid to pivot points to set price objectives:
| Pivot points | S3 | S2 | S1 | PP | R1 | R2 | R3 |
|---|---|---|---|---|---|---|---|
| Standard | 49.00 | 49.53 | 50.18 | 50.71 | 51.36 | 51.89 | 52.54 |
| Camarilla | 50.52 | 50.62 | 50.73 | 50.84 | 50.95 | 51.06 | 51.16 |
| Woodie | 49.07 | 49.56 | 50.25 | 50.74 | 51.43 | 51.92 | 52.61 |
| Fibonacci | 49.53 | 49.98 | 50.26 | 50.71 | 51.16 | 51.44 | 51.89 |
| Pivot points | S3 | S2 | S1 | PP | R1 | R2 | R3 |
|---|---|---|---|---|---|---|---|
| Standard | 50.81 | 51.64 | 52.80 | 53.63 | 54.79 | 55.62 | 56.78 |
| Camarilla | 53.40 | 53.59 | 53.77 | 53.95 | 54.13 | 54.32 | 54.50 |
| Woodie | 50.97 | 51.72 | 52.96 | 53.71 | 54.95 | 55.70 | 56.94 |
| Fibonacci | 51.64 | 52.40 | 52.87 | 53.63 | 54.39 | 54.86 | 55.62 |
| Pivot points | S3 | S2 | S1 | PP | R1 | R2 | R3 |
|---|---|---|---|---|---|---|---|
| Standard | 48.00 | 49.57 | 51.33 | 52.90 | 54.66 | 56.23 | 57.99 |
| Camarilla | 52.17 | 52.48 | 52.79 | 53.09 | 53.40 | 53.70 | 54.01 |
| Woodie | 48.10 | 49.62 | 51.43 | 52.95 | 54.76 | 56.28 | 58.09 |
| Fibonacci | 49.57 | 50.84 | 51.63 | 52.90 | 54.17 | 54.96 | 56.23 |
Numerical data
The following are the details of the technical indicators and moving averages that were collected to generate this technical analysis:
| RSI (14): | 43.42 | |
| MACD (12,26,9): | 0.0000 | |
| Directional Movement: | -13.78 | |
| AROON (14): | -28.57 | |
| DEMA (21): | 52.66 | |
| Parabolic SAR (0,02-0,02-0,2): | 53.80 | |
| Elder Ray (13): | -1.11 | |
| Super Trend (3,10): | 53.69 | |
| Zig ZAG (10): | 51.34 | |
| VORTEX (21): | 0.8900 | |
| Stochastique (14,3,5): | 21.64 | |
| TEMA (21): | 52.01 | |
| Williams %R (14): | -70.81 | |
| Chande Momentum Oscillator (20): | -2.24 | |
| Repulse (5,40,3): | -0.1600 | |
| ROCnROLL: | -1 | |
| TRIX (15,9): | 0.1300 | |
| Courbe Coppock: | 4.37 |
| MA7: | 52.32 | |
| MA20: | 52.93 | |
| MA50: | 51.48 | |
| MA100: | 49.52 | |
| MAexp7: | 51.94 | |
| MAexp20: | 52.42 | |
| MAexp50: | 51.53 | |
| MAexp100: | 50.00 | |
| Price / MA7: | -1.87% | |
| Price / MA20: | -3.00% | |
| Price / MA50: | -0.27% | |
| Price / MA100: | +3.68% | |
| Price / MAexp7: | -1.16% | |
| Price / MAexp20: | -2.06% | |
| Price / MAexp50: | -0.37% | |
| Price / MAexp100: | +2.68% |
News
The latest news and videos published on BROOKFIELD ASSET MANAGEMENT at the time of the analysis were as follows:
- Brookfield Asset Management Completes Acquisition Of 61.2% of Oaktree Capital Management
- Brookfield Asset Management Announces Results of Conversion of its Series 40 Preferred Shares
- Brookfield Asset Management and Oaktree Capital Group Announce the Anticipated Election Deadline
- Brookfield Announces Reset Dividend Rate on Its Series 40 and Series 25 Preference Shares
- Brookfield Asset Management Announces Delisting of its Shares From Euronext Amsterdam
About author

Online


Add a comment
Comments
0 comments on the analysis BROOKFIELD ASSET MANAGEMENT - Daily