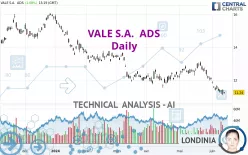
VALE S.A. ADS - Daily - Technical analysis published on 06/13/2024 (GMT)
- 133
- 0
Click here for a new analysis!
- Timeframe : Daily
- - Analysis generated on
- Status : LEVEL MAINTAINED

Summary of the analysis

Additional analysis
Quotes
VALE S.A. ADS rating 11.24 USD. The price has increased by +1.08% since the last closing and was traded between 11.15 USD and 11.26 USD over the period. The price is currently at +0.81% from its lowest and -0.18% from its highest.The Central Gaps scanner detects a bullish opening marking the presence of buyers ahead of sellers at the opening but not sufficiently marked to allow the price to register a quotation gap.
Bullish opening
Type : Bullish
Timeframe : Openning
A study of price movements over other periods shows the following variations:
Near a new LOW record (1 year)
Type : Bearish
Timeframe : Weekly
Near a new LOW record (1st january)
Type : Bearish
Timeframe : Weekly
Near a new LOW record (1 month)
Type : Bearish
Timeframe : Weekly
Technical
A technical analysis in Daily of this VALE S.A. ADS chart shows a sharp bearish trend. The signals given by moving averages are 92.86% bearish. This strong bearish trend is confirmed by the strong signals currently being given by short-term moving averages. The Central Indicators scanner does not detect any result on moving averages that would impact this trend.
An assessment of technical indicators does not currently provide any relevant information on the direction of future price movements.
But beware of excesses. The Central Indicators scanner currently detects this:
CCI indicator is oversold : under -100
Type : Neutral
Timeframe : Daily
RSI indicator: bullish divergence
Type : Bullish
Timeframe : Daily
Williams %R indicator is oversold : under -80
Type : Neutral
Timeframe : Daily
Price is back over the pivot point
Type : Bullish
Timeframe : Daily
The Central Patterns scanner, which studies chart patterns, resistances and supports, has identified these signals:
Near horizontal support
Type : Bullish
Timeframe : Daily
Near support of channel
Type : Bullish
Timeframe : Daily
Central Candlesticks, the scanner specialised in Japanese candlesticks, detects these signals that could have an impact on the current short-term trend:
Bullish harami
Type : Bullish
Timeframe : Daily
Doji
Type : Neutral
Timeframe : Daily
| S3 | S2 | S1 | Price | R1 | R2 | R3 | |
|---|---|---|---|---|---|---|---|
| ProTrendLines | 4.81 | 7.85 | 9.93 | 11.24 | 11.38 | 12.29 | 12.99 |
| Change (%) | -57.21% | -30.16% | -11.65% | - | +1.25% | +9.34% | +15.57% |
| Change | -6.43 | -3.39 | -1.31 | - | +0.14 | +1.05 | +1.75 |
| Level | Minor | Major | Major | - | Major | Major | Major |
Pivot points can also be used to set your price objectives. Here is the price situation in relation to pivot points:
| Pivot points | S3 | S2 | S1 | PP | R1 | R2 | R3 |
|---|---|---|---|---|---|---|---|
| Standard | 10.62 | 10.85 | 10.98 | 11.21 | 11.34 | 11.57 | 11.70 |
| Camarilla | 11.02 | 11.05 | 11.09 | 11.12 | 11.15 | 11.19 | 11.22 |
| Woodie | 10.58 | 10.83 | 10.94 | 11.19 | 11.30 | 11.55 | 11.66 |
| Fibonacci | 10.85 | 10.98 | 11.07 | 11.21 | 11.34 | 11.43 | 11.57 |
| Pivot points | S3 | S2 | S1 | PP | R1 | R2 | R3 |
|---|---|---|---|---|---|---|---|
| Standard | 10.53 | 10.92 | 11.14 | 11.53 | 11.75 | 12.14 | 12.36 |
| Camarilla | 11.18 | 11.24 | 11.29 | 11.35 | 11.41 | 11.46 | 11.52 |
| Woodie | 10.44 | 10.88 | 11.05 | 11.49 | 11.66 | 12.10 | 12.27 |
| Fibonacci | 10.92 | 11.16 | 11.30 | 11.53 | 11.77 | 11.91 | 12.14 |
| Pivot points | S3 | S2 | S1 | PP | R1 | R2 | R3 |
|---|---|---|---|---|---|---|---|
| Standard | 10.45 | 11.20 | 11.63 | 12.38 | 12.81 | 13.56 | 13.99 |
| Camarilla | 11.73 | 11.83 | 11.94 | 12.05 | 12.16 | 12.27 | 12.38 |
| Woodie | 10.28 | 11.12 | 11.46 | 12.30 | 12.64 | 13.48 | 13.82 |
| Fibonacci | 11.20 | 11.65 | 11.93 | 12.38 | 12.83 | 13.11 | 13.56 |
Numerical data
The following is the status of the technical indicators and moving averages at the time of publication of this technical analysis:
| RSI (14): | 30.25 | |
| MACD (12,26,9): | -0.3300 | |
| Directional Movement: | -21.32 | |
| AROON (14): | -85.72 | |
| DEMA (21): | 11.44 | |
| Parabolic SAR (0,02-0,02-0,2): | 11.75 | |
| Elder Ray (13): | -0.42 | |
| Super Trend (3,10): | 11.97 | |
| Zig ZAG (10): | 11.20 | |
| VORTEX (21): | 0.7200 | |
| Stochastique (14,3,5): | 8.41 | |
| TEMA (21): | 11.19 | |
| Williams %R (14): | -92.24 | |
| Chande Momentum Oscillator (20): | -1.16 | |
| Repulse (5,40,3): | -1.0000 | |
| ROCnROLL: | 2 | |
| TRIX (15,9): | -0.2500 | |
| Courbe Coppock: | 20.09 |
| MA7: | 11.36 | |
| MA20: | 12.04 | |
| MA50: | 12.18 | |
| MA100: | 12.62 | |
| MAexp7: | 11.39 | |
| MAexp20: | 11.81 | |
| MAexp50: | 12.19 | |
| MAexp100: | 12.62 | |
| Price / MA7: | -1.06% | |
| Price / MA20: | -6.64% | |
| Price / MA50: | -7.72% | |
| Price / MA100: | -10.94% | |
| Price / MAexp7: | -1.32% | |
| Price / MAexp20: | -4.83% | |
| Price / MAexp50: | -7.79% | |
| Price / MAexp100: | -10.94% |
About author
Online


Add a comment
Comments
0 comments on the analysis VALE S.A. ADS - Daily