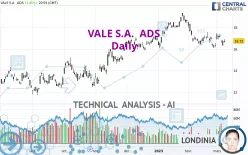
VALE S.A. ADS - Daily - Technical analysis published on 03/09/2023 (GMT)
- 138
- 0
Click here for a new analysis!
- Timeframe : Daily
- - Analysis generated on
- Status : TARGET REACHED

Summary of the analysis

Additional analysis
Quotes
The VALE S.A. ADS rating is 16.72 USD. The price registered an increase of +2.45% on the session and was traded between 16.59 USD and 16.91 USD over the period. The price is currently at +0.78% from its lowest and -1.12% from its highest.The Central Gaps scanner detects a bullish opening marking the presence of buyers ahead of sellers at the opening but not sufficiently marked to allow the price to register a quotation gap.
Bullish opening
Type : Bullish
Timeframe : Openning
So that you have an overall view of the price change, here is a table showing the variations over several periods:
Near a new LOW record (1st january)
Type : Bearish
Timeframe : Weekly
Near a new HIGH record (1 month)
Type : Bullish
Timeframe : Weekly
Technical
Technical analysis of this Daily chart of VALE S.A. ADS indicates that the overall trend is not clearly defined. The strong bearish signals currently being given by short-term moving averages could allow the overall trend to return to a bearish trend. An assessment of moving averages reveals a bullish signal that could impact this trend:
Bullish price crossover with adaptative moving average 100
Type : Bullish
Timeframe : Daily
In fact, of the 18 technical indicators analysed by Central Analyzer, 5 are bullish, 6 are neutral and 7 are bearish. But beware of excesses. The Central Indicators scanner currently detects this:
MACD indicator: bullish divergence
Type : Bullish
Timeframe : Daily
Pivot points : price is over resistance 1
Type : Neutral
Timeframe : Daily
An analysis of the price chart with the Central Patterns scanner (detector of chart patterns and resistances and supports) shows several results that can have an impact on the price change:
Near horizontal support
Type : Bullish
Timeframe : Daily
Near support of channel
Type : Bullish
Timeframe : Daily
Near support of triangle
Type : Bullish
Timeframe : Daily
The Central Candlesticks scanner, specialised in Japanese candlesticks, did not identify any signals.
| S3 | S2 | S1 | Price | R1 | R2 | R3 | |
|---|---|---|---|---|---|---|---|
| ProTrendLines | 14.73 | 15.59 | 16.31 | 16.72 | 17.71 | 19.32 | 20.51 |
| Change (%) | -11.90% | -6.76% | -2.45% | - | +5.92% | +15.55% | +22.67% |
| Change | -1.99 | -1.13 | -0.41 | - | +0.99 | +2.60 | +3.79 |
| Level | Minor | Intermediate | Major | - | Major | Major | Major |
To determine price objectives, it is also possible to use the pivot points. Here is the price position in relation to pivot points:
| Pivot points | S3 | S2 | S1 | PP | R1 | R2 | R3 |
|---|---|---|---|---|---|---|---|
| Standard | 16.25 | 16.42 | 16.57 | 16.74 | 16.89 | 17.06 | 17.21 |
| Camarilla | 16.63 | 16.66 | 16.69 | 16.72 | 16.75 | 16.78 | 16.81 |
| Woodie | 16.24 | 16.42 | 16.56 | 16.74 | 16.88 | 17.06 | 17.20 |
| Fibonacci | 16.42 | 16.54 | 16.62 | 16.74 | 16.86 | 16.94 | 17.06 |
| Pivot points | S3 | S2 | S1 | PP | R1 | R2 | R3 |
|---|---|---|---|---|---|---|---|
| Standard | 14.94 | 15.52 | 16.32 | 16.90 | 17.70 | 18.28 | 19.08 |
| Camarilla | 16.73 | 16.86 | 16.98 | 17.11 | 17.24 | 17.36 | 17.49 |
| Woodie | 15.04 | 15.58 | 16.42 | 16.96 | 17.80 | 18.34 | 19.18 |
| Fibonacci | 15.52 | 16.05 | 16.38 | 16.90 | 17.43 | 17.76 | 18.28 |
| Pivot points | S3 | S2 | S1 | PP | R1 | R2 | R3 |
|---|---|---|---|---|---|---|---|
| Standard | 13.04 | 14.57 | 15.46 | 16.99 | 17.88 | 19.41 | 20.30 |
| Camarilla | 15.68 | 15.90 | 16.12 | 16.34 | 16.56 | 16.78 | 17.01 |
| Woodie | 12.71 | 14.41 | 15.13 | 16.83 | 17.55 | 19.25 | 19.97 |
| Fibonacci | 14.57 | 15.50 | 16.07 | 16.99 | 17.92 | 18.49 | 19.41 |
Numerical data
The following is the status of the technical indicators and moving averages at the time of publication of this technical analysis:
| RSI (14): | 46.06 | |
| MACD (12,26,9): | -0.1900 | |
| Directional Movement: | -3.71 | |
| AROON (14): | -28.57 | |
| DEMA (21): | 16.67 | |
| Parabolic SAR (0,02-0,02-0,2): | 16.24 | |
| Elder Ray (13): | -0.06 | |
| Super Trend (3,10): | 17.60 | |
| Zig ZAG (10): | 16.72 | |
| VORTEX (21): | 0.9000 | |
| Stochastique (14,3,5): | 32.41 | |
| TEMA (21): | 16.49 | |
| Williams %R (14): | -57.64 | |
| Chande Momentum Oscillator (20): | -0.30 | |
| Repulse (5,40,3): | -1.8900 | |
| ROCnROLL: | 2 | |
| TRIX (15,9): | -0.1800 | |
| Courbe Coppock: | 1.88 |
| MA7: | 16.80 | |
| MA20: | 16.80 | |
| MA50: | 17.37 | |
| MA100: | 16.13 | |
| MAexp7: | 16.73 | |
| MAexp20: | 16.91 | |
| MAexp50: | 16.92 | |
| MAexp100: | 16.39 | |
| Price / MA7: | -0.48% | |
| Price / MA20: | -0.48% | |
| Price / MA50: | -3.74% | |
| Price / MA100: | +3.66% | |
| Price / MAexp7: | -0.06% | |
| Price / MAexp20: | -1.12% | |
| Price / MAexp50: | -1.18% | |
| Price / MAexp100: | +2.01% |
About author

Online


Add a comment
Comments
0 comments on the analysis VALE S.A. ADS - Daily