COMMERCIAL METALS CO. - Daily - Technical analysis published on 11/13/2019 (GMT)
- 233
- 0
- Who voted?
Click here for a new analysis!
- Timeframe : Daily
- - Analysis generated on
- Status : TARGET REACHED
Summary of the analysis

Additional analysis
Quotes
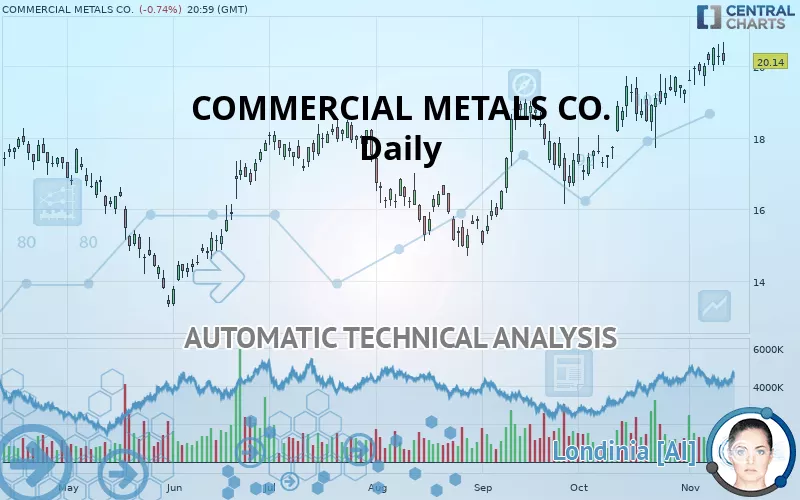
COMMERCIAL METALS CO. rating 20.14 USD. On the day, this instrument lost -0.74% with the lowest point at 20.04 USD and the highest point at 20.67 USD. The deviation from the price is +0.50% for the low point and -2.56% for the high point.So that you have an overall view of the price change, here is a table showing the variations over several periods:
New HIGH record (1 year)
Type : Bullish
Timeframe : Weekly
New HIGH record (1st january)
Type : Bullish
Timeframe : Weekly
New HIGH record (1 month)
Type : Bullish
Timeframe : Weekly
Technical
Technical analysis of this Daily chart of COMMERCIAL METALS CO. indicates that the overall trend is strongly bullish. 92.86% of the signals given by moving averages are bullish. The overall trend is supported by the strong bullish signals from short-term moving averages. There is no crossing of moving average by the price or crossing of moving averages between themselves.
The technical indicators are bullish. There is still some doubt about the price increase.
Caution: the Central Indicators scanner currently detects an excess:
CCI indicator is overbought : over 100
Type : Neutral
Timeframe : Daily
MACD indicator: bearish divergence
Type : Bearish
Timeframe : Daily
Williams %R indicator is overbought : over -20
Type : Neutral
Timeframe : Daily
Price is back over the pivot point
Type : Bullish
Timeframe : Weekly
Price is back under the pivot point
Type : Bearish
Timeframe : Daily
The analysis of the price chart with Central Patterns scanners does not return any result.
No result was found by the Central Candlesticks scanner on Japanese candlesticks.
| S3 | S2 | S1 | Price | R1 | R2 | R3 | |
|---|---|---|---|---|---|---|---|
| ProTrendLines | 14.96 | 16.75 | 18.31 | 20.14 | 20.58 | 23.14 | 24.34 |
| Change (%) | -25.72% | -16.83% | -9.09% | - | +2.18% | +14.90% | +20.85% |
| Change | -5.18 | -3.39 | -1.83 | - | +0.44 | +3.00 | +4.20 |
| Level | Major | Minor | Major | - | Major | Minor | Intermediate |
Pivot points can also be used to set your price objectives. Here is the price situation in relation to pivot points:
| Pivot points | S3 | S2 | S1 | PP | R1 | R2 | R3 |
|---|---|---|---|---|---|---|---|
| Standard | 19.43 | 19.74 | 20.01 | 20.32 | 20.59 | 20.90 | 21.17 |
| Camarilla | 20.13 | 20.18 | 20.24 | 20.29 | 20.34 | 20.40 | 20.45 |
| Woodie | 19.42 | 19.73 | 20.00 | 20.31 | 20.58 | 20.89 | 21.16 |
| Fibonacci | 19.74 | 19.96 | 20.10 | 20.32 | 20.54 | 20.68 | 20.90 |
| Pivot points | S3 | S2 | S1 | PP | R1 | R2 | R3 |
|---|---|---|---|---|---|---|---|
| Standard | 18.61 | 18.97 | 19.67 | 20.04 | 20.74 | 21.10 | 21.80 |
| Camarilla | 20.08 | 20.18 | 20.28 | 20.38 | 20.47 | 20.57 | 20.67 |
| Woodie | 18.78 | 19.06 | 19.85 | 20.12 | 20.91 | 21.18 | 21.97 |
| Fibonacci | 18.97 | 19.38 | 19.63 | 20.04 | 20.44 | 20.69 | 21.10 |
| Pivot points | S3 | S2 | S1 | PP | R1 | R2 | R3 |
|---|---|---|---|---|---|---|---|
| Standard | 14.42 | 15.56 | 17.39 | 18.53 | 20.36 | 21.50 | 23.32 |
| Camarilla | 18.40 | 18.67 | 18.94 | 19.21 | 19.49 | 19.76 | 20.03 |
| Woodie | 14.76 | 15.73 | 17.73 | 18.70 | 20.70 | 21.67 | 23.66 |
| Fibonacci | 15.56 | 16.70 | 17.40 | 18.53 | 19.66 | 20.36 | 21.50 |
Numerical data
The following is the status of technical indicators and moving averages registered at the time this technical analysis was created:
| RSI (14): | 64.64 | |
| MACD (12,26,9): | 0.6100 | |
| Directional Movement: | 9.20 | |
| AROON (14): | 100.00 | |
| DEMA (21): | 20.24 | |
| Parabolic SAR (0,02-0,02-0,2): | 19.70 | |
| Elder Ray (13): | 0.59 | |
| Super Trend (3,10): | 18.51 | |
| Zig ZAG (10): | 20.14 | |
| VORTEX (21): | 1.0900 | |
| Stochastique (14,3,5): | 86.75 | |
| TEMA (21): | 20.41 | |
| Williams %R (14): | -28.14 | |
| Chande Momentum Oscillator (20): | 1.02 | |
| Repulse (5,40,3): | -1.1500 | |
| ROCnROLL: | 1 | |
| TRIX (15,9): | 0.4500 | |
| Courbe Coppock: | 13.19 |
| MA7: | 20.11 | |
| MA20: | 19.40 | |
| MA50: | 18.31 | |
| MA100: | 17.57 | |
| MAexp7: | 20.06 | |
| MAexp20: | 19.45 | |
| MAexp50: | 18.51 | |
| MAexp100: | 17.79 | |
| Price / MA7: | +0.15% | |
| Price / MA20: | +3.81% | |
| Price / MA50: | +9.99% | |
| Price / MA100: | +14.63% | |
| Price / MAexp7: | +0.40% | |
| Price / MAexp20: | +3.55% | |
| Price / MAexp50: | +8.81% | |
| Price / MAexp100: | +13.21% |
News
Don"t forget to follow the news on COMMERCIAL METALS CO.. At the time of publication of this analysis, the latest news was as follows:
- Commercial Metals Company Reports Fourth Quarter And Full Year Fiscal 2019 Results
- Commercial Metals Company Announces Quarterly Dividend Of $0.12 Per Share
- Commercial Metals Company Announces Fourth Quarter Fiscal 2019 Conference Call Webcast Details
- JPMorgan Chase & Co. to Host Earnings Call
- Commercial Metals Company Announces Retirement Of Lindsey And Promotion Of Lawrence To Chief Financial Officer
About author

Online


Add a comment
Comments
0 comments on the analysis COMMERCIAL METALS CO. - Daily