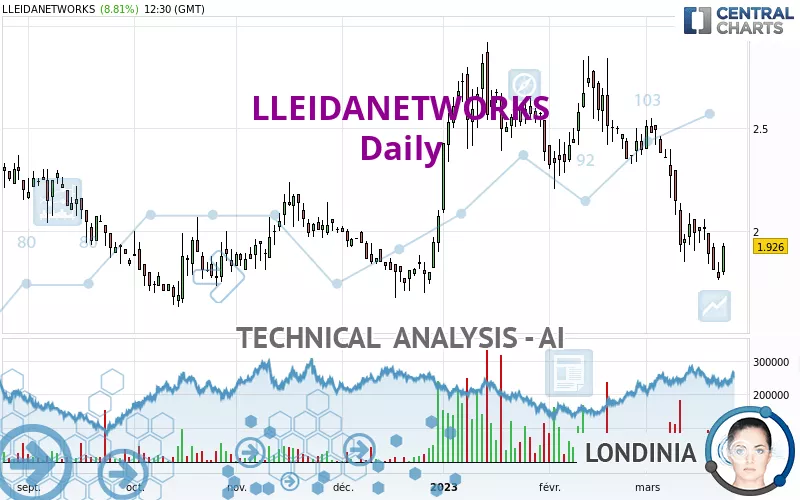
LLEIDANETWORKS - Daily - Technical analysis published on 03/23/2023 (GMT)
- 217
- 0
Click here for a new analysis!
- Timeframe : Daily
- - Analysis generated on
- Status : TARGET REACHED
Summary of the analysis

Additional analysis
Quotes
The LLEIDANETWORKS price is 1.926 EUR. The price has increased by +8.81% since the last closing and was between 1.788 EUR and 1.940 EUR. This implies that the price is at +7.72% from its lowest and at -0.72% from its highest.A bullish opening was detected by the Central Gaps scanner. Buyers are trying to impose a bullish momentum in the very short term.
Bullish opening
Type : Bullish
Timeframe : Openning
A study of price movements over other periods shows the following variations:
Near a new LOW record (1st january)
Type : Bearish
Timeframe : Weekly
Near a new LOW record (1 month)
Type : Bearish
Timeframe : Weekly
Abnormal volumes on LLEIDANETWORKS were detected by the Central Volumes scanner:
Abnormal volumes
Timeframe : 50 days
Technical
Technical analysis of LLEIDANETWORKS in Daily shows an overall bearish trend. 78.57% of the signals given by moving averages are bearish. The overall trend is reinforced by the strong bearish signals from short-term moving averages. The Central Indicators market scanner currently does not detect any result that concerns moving averages.
In fact, of the 18 technical indicators analysed by Central Analyzer, 6 are bullish, 2 are neutral and 10 are bearish. Caution: the Central Indicators scanner currently detects an excess:
CCI indicator: bullish divergence
Type : Bullish
Timeframe : Daily
RSI indicator: bullish divergence
Type : Bullish
Timeframe : Daily
Pivot points : price is over resistance 3
Type : Neutral
Timeframe : Daily
Price is back under the pivot point
Type : Bearish
Timeframe : Weekly
Central Patterns, the market scanner focusing on chart patterns, resistances and supports found this result:
Near horizontal resistance
Type : Bearish
Timeframe : Daily
For a small rebound in the very short term, the Central Candlesticks scanner currently notes the presence of this bullish pattern in Japanese candlesticks:
White morning star
Type : Bullish
Timeframe : Daily
| S2 | S1 | Price | R1 | R2 | R3 | |
|---|---|---|---|---|---|---|
| ProTrendLines | 0.958 | 1.721 | 1.926 | 1.932 | 2.170 | 2.507 |
| Change (%) | -50.26% | -10.64% | - | +0.31% | +12.67% | +30.17% |
| Change | -0.968 | -0.205 | - | +0.006 | +0.244 | +0.581 |
| Level | Minor | Major | - | Minor | Minor | Major |
Attention could also be paid to pivot points to set price objectives:
| Pivot points | S3 | S2 | S1 | PP | R1 | R2 | R3 |
|---|---|---|---|---|---|---|---|
| Standard | 1.647 | 1.703 | 1.737 | 1.793 | 1.827 | 1.883 | 1.917 |
| Camarilla | 1.745 | 1.754 | 1.762 | 1.770 | 1.778 | 1.787 | 1.795 |
| Woodie | 1.635 | 1.698 | 1.725 | 1.788 | 1.815 | 1.878 | 1.905 |
| Fibonacci | 1.703 | 1.738 | 1.759 | 1.793 | 1.828 | 1.849 | 1.883 |
| Pivot points | S3 | S2 | S1 | PP | R1 | R2 | R3 |
|---|---|---|---|---|---|---|---|
| Standard | 1.637 | 1.743 | 1.877 | 1.983 | 2.117 | 2.223 | 2.357 |
| Camarilla | 1.944 | 1.966 | 1.988 | 2.010 | 2.032 | 2.054 | 2.076 |
| Woodie | 1.650 | 1.750 | 1.890 | 1.990 | 2.130 | 2.230 | 2.370 |
| Fibonacci | 1.743 | 1.835 | 1.892 | 1.983 | 2.075 | 2.132 | 2.223 |
| Pivot points | S3 | S2 | S1 | PP | R1 | R2 | R3 |
|---|---|---|---|---|---|---|---|
| Standard | 1.472 | 1.838 | 2.117 | 2.483 | 2.762 | 3.128 | 3.407 |
| Camarilla | 2.218 | 2.277 | 2.336 | 2.395 | 2.454 | 2.513 | 2.572 |
| Woodie | 1.428 | 1.816 | 2.073 | 2.461 | 2.718 | 3.106 | 3.363 |
| Fibonacci | 1.838 | 2.085 | 2.237 | 2.483 | 2.730 | 2.882 | 3.128 |
Numerical data
The following are the details of the technical indicators and moving averages that were collected to generate this technical analysis:
| RSI (14): | 37.62 | |
| MACD (12,26,9): | -0.1580 | |
| Directional Movement: | -11.563 | |
| AROON (14): | -92.857 | |
| DEMA (21): | 1.909 | |
| Parabolic SAR (0,02-0,02-0,2): | 1.984 | |
| Elder Ray (13): | -0.147 | |
| Super Trend (3,10): | 2.218 | |
| Zig ZAG (10): | 1.926 | |
| VORTEX (21): | 0.7460 | |
| Stochastique (14,3,5): | 8.35 | |
| TEMA (21): | 1.795 | |
| Williams %R (14): | -76.29 | |
| Chande Momentum Oscillator (20): | -0.434 | |
| Repulse (5,40,3): | 0.2970 | |
| ROCnROLL: | 2 | |
| TRIX (15,9): | -0.7980 | |
| Courbe Coppock: | 42.55 |
| MA7: | 1.913 | |
| MA20: | 2.158 | |
| MA50: | 2.377 | |
| MA100: | 2.221 | |
| MAexp7: | 1.917 | |
| MAexp20: | 2.100 | |
| MAexp50: | 2.241 | |
| MAexp100: | 2.277 | |
| Price / MA7: | +0.68% | |
| Price / MA20: | -10.75% | |
| Price / MA50: | -18.97% | |
| Price / MA100: | -13.28% | |
| Price / MAexp7: | +0.47% | |
| Price / MAexp20: | -8.29% | |
| Price / MAexp50: | -14.06% | |
| Price / MAexp100: | -15.42% |
News
The last news published on LLEIDANETWORKS at the time of the generation of this analysis was as follows:
About author
Online


Add a comment
Comments
0 comments on the analysis LLEIDANETWORKS - Daily