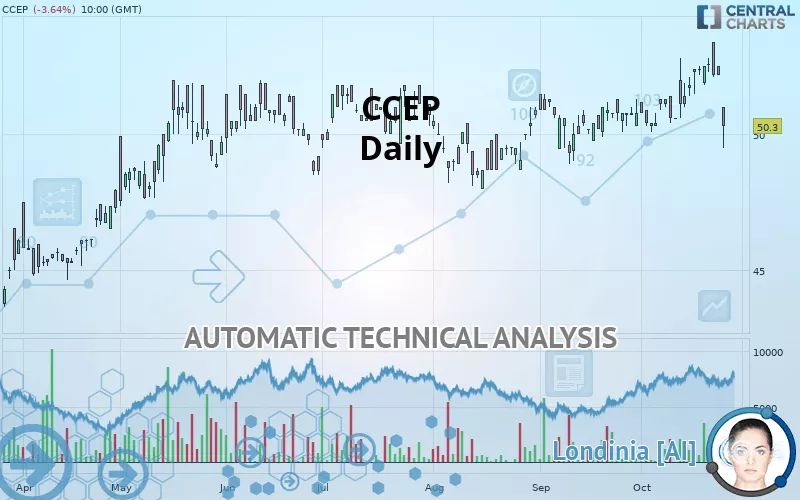
CCEP - Daily - Technical analysis published on 10/24/2019 (GMT)
- 237
- 0
- Who voted?
Click here for a new analysis!
- Timeframe : Daily
- - Analysis generated on
- Status : TARGET REACHED
Summary of the analysis

Additional analysis
Quotes
The CCEP price is 50.30 EUR. The price is lower by -3.64% since the last closing with the lowest point at 49.50 EUR and the highest point at 51.00 EUR. The deviation from the price is +1.62% for the low point and -1.37% for the high point.The Central Gaps scanner detects the formation of a bearish gap marking the strong presence of sellers ahead of buyers at the opening. This formed a quotation gap.
Opening Gap DOWN
Type : Bearish
Timeframe : Openning
A study of price movements over other periods shows the following variations:
Near a new HIGH record (1st january)
Type : Bullish
Timeframe : Weekly
Near a new HIGH record (1 month)
Type : Bullish
Timeframe : Weekly
Technical
A technical analysis in Daily of this CCEP chart shows a neutral trend. The strong bearish signals currently being given by short-term moving averages could allow the overall trend to return to a bearish trend. There is no crossing of moving average by the price or crossing of moving averages between themselves.
In fact, 10 technical indicators on 18 studied are currently positioned bearish. Central Indicators, the scanner specialised in technical indicators, has identified these signals:
Pivot points : price is under support 3
Type : Neutral
Timeframe : Daily
Pivot points : price is under support 3
Type : Neutral
Timeframe : Weekly
Price is back over the pivot point
Type : Bullish
Timeframe : Weekly
The Central Patterns scanner, which studies chart patterns, resistances and supports, has identified this signal:
Horizontal support is broken
Type : Bearish
Timeframe : Daily
No result was found by the Central Candlesticks scanner on Japanese candlesticks.
| S3 | S2 | S1 | Price | R1 | |
|---|---|---|---|---|---|
| ProTrendLines | 40.80 | 43.06 | 48.52 | 50.30 | 51.17 |
| Change (%) | -18.89% | -14.39% | -3.54% | - | +1.73% |
| Change | -9.50 | -7.24 | -1.78 | - | +0.87 |
| Level | Minor | Minor | Major | - | Intermediate |
Pivot points can also be used to set your price objectives. Here is the price situation in relation to pivot points:
| Pivot points | S3 | S2 | S1 | PP | R1 | R2 | R3 |
|---|---|---|---|---|---|---|---|
| Standard | 51.80 | 52.00 | 52.10 | 52.30 | 52.40 | 52.60 | 52.70 |
| Camarilla | 52.12 | 52.15 | 52.17 | 52.20 | 52.23 | 52.26 | 52.28 |
| Woodie | 51.75 | 51.98 | 52.05 | 52.28 | 52.35 | 52.58 | 52.65 |
| Fibonacci | 52.00 | 52.12 | 52.19 | 52.30 | 52.42 | 52.49 | 52.60 |
| Pivot points | S3 | S2 | S1 | PP | R1 | R2 | R3 |
|---|---|---|---|---|---|---|---|
| Standard | 50.00 | 50.50 | 51.50 | 52.00 | 53.00 | 53.50 | 54.50 |
| Camarilla | 52.09 | 52.23 | 52.36 | 52.50 | 52.64 | 52.78 | 52.91 |
| Woodie | 50.25 | 50.63 | 51.75 | 52.13 | 53.25 | 53.63 | 54.75 |
| Fibonacci | 50.50 | 51.07 | 51.43 | 52.00 | 52.57 | 52.93 | 53.50 |
| Pivot points | S3 | S2 | S1 | PP | R1 | R2 | R3 |
|---|---|---|---|---|---|---|---|
| Standard | 46.70 | 47.80 | 49.30 | 50.40 | 51.90 | 53.00 | 54.50 |
| Camarilla | 50.09 | 50.32 | 50.56 | 50.80 | 51.04 | 51.28 | 51.52 |
| Woodie | 46.90 | 47.90 | 49.50 | 50.50 | 52.10 | 53.10 | 54.70 |
| Fibonacci | 47.80 | 48.79 | 49.41 | 50.40 | 51.39 | 52.01 | 53.00 |
Numerical data
The following is the status of technical indicators and moving averages registered at the time this technical analysis was created:
| RSI (14): | 39.03 | |
| MACD (12,26,9): | 0.3500 | |
| Directional Movement: | -6.98 | |
| AROON (14): | -14.29 | |
| DEMA (21): | 51.85 | |
| Parabolic SAR (0,02-0,02-0,2): | 53.40 | |
| Elder Ray (13): | -1.31 | |
| Super Trend (3,10): | 53.04 | |
| Zig ZAG (10): | 50.20 | |
| VORTEX (21): | 0.9900 | |
| Stochastique (14,3,5): | 47.63 | |
| TEMA (21): | 51.95 | |
| Williams %R (14): | -82.05 | |
| Chande Momentum Oscillator (20): | -0.90 | |
| Repulse (5,40,3): | -2.7000 | |
| ROCnROLL: | 2 | |
| TRIX (15,9): | 0.1100 | |
| Courbe Coppock: | 4.74 |
| MA7: | 52.06 | |
| MA20: | 51.28 | |
| MA50: | 50.60 | |
| MA100: | 50.47 | |
| MAexp7: | 51.64 | |
| MAexp20: | 51.39 | |
| MAexp50: | 50.83 | |
| MAexp100: | 49.93 | |
| Price / MA7: | -3.38% | |
| Price / MA20: | -1.91% | |
| Price / MA50: | -0.59% | |
| Price / MA100: | -0.34% | |
| Price / MAexp7: | -2.59% | |
| Price / MAexp20: | -2.12% | |
| Price / MAexp50: | -1.04% | |
| Price / MAexp100: | +0.74% |
News
The latest news and videos published on CCEP at the time of the analysis were as follows:
- Coca-Cola European Partners plc Announces Annual Financial Report and Summary Document
- NEC Awarded Contract with NSW Telco Authority as Part of CCEP
About author

Online


Add a comment
Comments
0 comments on the analysis CCEP - Daily