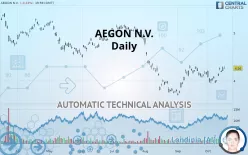
AEGON - Daily - Technical analysis published on 10/17/2019 (GMT)
- 366
- 0
- Who voted?
Click here for a new analysis!
- Timeframe : Daily
- - Analysis generated on
- Status : TARGET REACHED

Summary of the analysis

Additional analysis
Quotes
AEGON N.V. rating 4.26 USD. The price registered a decrease of -0.23% on the session and was traded between 4.26 USD and 4.30 USD over the period. The price is currently at 0% from its lowest and -0.93% from its highest.The Central Gaps scanner detects a bearish opening. A small advantage for sellers in the very short term.
Bearish opening
Type : Bearish
Timeframe : Openning
A study of price movements over other periods shows the following variations:
Near a new HIGH record (1 month)
Type : Bullish
Timeframe : Weekly
Technical
Technical analysis of AEGON N.V. in Daily shows a neutral overall trend. The strong bullish signals currently being given by short-term moving averages could allow the overall trend to return to bullish. The Central Indicators scanner detects bullish signals on moving averages that could impact this trend:
Bullish trend reversal : Moving Average 20
Type : Bullish
Timeframe : Daily
Bullish trend reversal : Moving Average 50
Type : Bullish
Timeframe : Daily
In fact, 14 technical indicators on 18 studied are currently bullish. Caution: the Central Indicators scanner currently detects an excess:
CCI indicator is overbought : over 100
Type : Neutral
Timeframe : Daily
Williams %R indicator is overbought : over -20
Type : Neutral
Timeframe : Daily
Price is back over the pivot point
Type : Bullish
Timeframe : Daily
Price is back over the pivot point
Type : Bullish
Timeframe : Weekly
Central Patterns, the market scanner focusing on chart patterns, resistances and supports found this result:
Near horizontal resistance
Type : Bearish
Timeframe : Daily
The Central Candlesticks scanner which studies Japanese candlesticks did not detect anything.
| S3 | S2 | S1 | Price | R1 | R2 | R3 | |
|---|---|---|---|---|---|---|---|
| ProTrendLines | 3.69 | 3.95 | 4.16 | 4.26 | 4.30 | 4.50 | 4.76 |
| Change (%) | -13.38% | -7.28% | -2.35% | - | +0.94% | +5.63% | +11.74% |
| Change | -0.57 | -0.31 | -0.10 | - | +0.04 | +0.24 | +0.50 |
| Level | Major | Intermediate | Intermediate | - | Intermediate | Minor | Minor |
To determine price objectives, it is also possible to use the pivot points. Here is the price position in relation to pivot points:
| Pivot points | S3 | S2 | S1 | PP | R1 | R2 | R3 |
|---|---|---|---|---|---|---|---|
| Standard | 4.10 | 4.15 | 4.21 | 4.26 | 4.32 | 4.36 | 4.42 |
| Camarilla | 4.24 | 4.25 | 4.26 | 4.27 | 4.28 | 4.29 | 4.30 |
| Woodie | 4.11 | 4.15 | 4.22 | 4.26 | 4.32 | 4.37 | 4.43 |
| Fibonacci | 4.15 | 4.19 | 4.22 | 4.26 | 4.30 | 4.32 | 4.36 |
| Pivot points | S3 | S2 | S1 | PP | R1 | R2 | R3 |
|---|---|---|---|---|---|---|---|
| Standard | 3.70 | 3.83 | 4.03 | 4.16 | 4.36 | 4.49 | 4.69 |
| Camarilla | 4.15 | 4.18 | 4.21 | 4.24 | 4.27 | 4.30 | 4.33 |
| Woodie | 3.75 | 3.85 | 4.08 | 4.18 | 4.41 | 4.51 | 4.74 |
| Fibonacci | 3.83 | 3.95 | 4.03 | 4.16 | 4.28 | 4.36 | 4.49 |
| Pivot points | S3 | S2 | S1 | PP | R1 | R2 | R3 |
|---|---|---|---|---|---|---|---|
| Standard | 3.14 | 3.42 | 3.77 | 4.05 | 4.40 | 4.68 | 5.03 |
| Camarilla | 3.96 | 4.02 | 4.07 | 4.13 | 4.19 | 4.25 | 4.30 |
| Woodie | 3.19 | 3.44 | 3.82 | 4.07 | 4.45 | 4.70 | 5.08 |
| Fibonacci | 3.42 | 3.66 | 3.81 | 4.05 | 4.29 | 4.44 | 4.68 |
Numerical data
The following are the details of the technical indicators and moving averages that were collected to generate this technical analysis:
| RSI (14): | 59.57 | |
| MACD (12,26,9): | 0.0300 | |
| Directional Movement: | 12.10 | |
| AROON (14): | 57.15 | |
| DEMA (21): | 4.16 | |
| Parabolic SAR (0,02-0,02-0,2): | 3.99 | |
| Elder Ray (13): | 0.13 | |
| Super Trend (3,10): | 4.02 | |
| Zig ZAG (10): | 4.26 | |
| VORTEX (21): | 0.9700 | |
| Stochastique (14,3,5): | 84.85 | |
| TEMA (21): | 4.21 | |
| Williams %R (14): | -12.33 | |
| Chande Momentum Oscillator (20): | 0.13 | |
| Repulse (5,40,3): | 0.7600 | |
| ROCnROLL: | 1 | |
| TRIX (15,9): | 0.0400 | |
| Courbe Coppock: | 1.29 |
| MA7: | 4.15 | |
| MA20: | 4.12 | |
| MA50: | 4.02 | |
| MA100: | 4.35 | |
| MAexp7: | 4.19 | |
| MAexp20: | 4.13 | |
| MAexp50: | 4.16 | |
| MAexp100: | 4.30 | |
| Price / MA7: | +2.65% | |
| Price / MA20: | +3.40% | |
| Price / MA50: | +5.97% | |
| Price / MA100: | -2.07% | |
| Price / MAexp7: | +1.67% | |
| Price / MAexp20: | +3.15% | |
| Price / MAexp50: | +2.40% | |
| Price / MAexp100: | -0.93% |
About author

Online


Add a comment
Comments
0 comments on the analysis AEGON - Daily