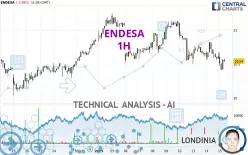
ENDESA - 1H - Technical analysis published on 01/15/2025 (GMT)
- 94
- 0
Click here for a new analysis!
- Timeframe : 1H
- - Analysis generated on
- Status : INVALID

Summary of the analysis

Additional analysis
Quotes
The ENDESA price is 20.540 EUR. The price registered a decrease of -0.39% on the session and was traded between 20.410 EUR and 20.670 EUR over the period. The price is currently at +0.64% from its lowest and -0.63% from its highest.A bearish opening was detected by the Central Gaps scanner. Sellers are trying to impose a bearish trend in the very short term.
Bearish opening
Type : Bearish
Timeframe : Openning
So that you have an overall view of the price change, here is a table showing the variations over several periods:
Near a new HIGH record (5 years)
Type : Bullish
Timeframe : Weekly
Near a new HIGH record (1 year)
Type : Bullish
Timeframe : Weekly
Near a new HIGH record (1st january)
Type : Bullish
Timeframe : Weekly
Near a new LOW record (1 month)
Type : Bearish
Timeframe : Weekly
Technical
Technical analysis of this 1H chart of ENDESA indicates that the overall trend is bearish. 67.86% of the signals given by moving averages are bearish. The overall trend is reinforced by the strong bearish signals from short-term moving averages. The Central Indicators market scanner currently does not detect any result that concerns moving averages.
In fact, 11 technical indicators on 18 studied are currently positioned bearish. Caution: the Central Indicators scanner currently detects an excess:
CCI indicator is oversold : under -100
Type : Neutral
Timeframe : 1 hour
Previous candle closed under Bollinger bands
Type : Neutral
Timeframe : 1 hour
An analysis of the price chart with the Central Patterns scanner (detector of chart patterns and resistances and supports) shows a result that can have an impact on the price change:
Near support of channel
Type : Bullish
Timeframe : 1 hour
No result was found by the Central Candlesticks scanner on Japanese candlesticks.
| S3 | S2 | S1 | Price | R1 | R2 | R3 | |
|---|---|---|---|---|---|---|---|
| ProTrendLines | 19.507 | 19.837 | 20.023 | 20.540 | 20.561 | 20.753 | 20.961 |
| Change (%) | -5.03% | -3.42% | -2.52% | - | +0.10% | +1.04% | +2.05% |
| Change | -1.033 | -0.703 | -0.517 | - | +0.021 | +0.213 | +0.421 |
| Level | Intermediate | Minor | Intermediate | - | Intermediate | Intermediate | Major |
Attention could also be paid to pivot points to set price objectives:
| Pivot points | S3 | S2 | S1 | PP | R1 | R2 | R3 |
|---|---|---|---|---|---|---|---|
| Standard | 20.240 | 20.400 | 20.510 | 20.670 | 20.780 | 20.940 | 21.050 |
| Camarilla | 20.546 | 20.571 | 20.595 | 20.620 | 20.645 | 20.670 | 20.694 |
| Woodie | 20.215 | 20.388 | 20.485 | 20.658 | 20.755 | 20.928 | 21.025 |
| Fibonacci | 20.400 | 20.503 | 20.567 | 20.670 | 20.773 | 20.837 | 20.940 |
| Pivot points | S3 | S2 | S1 | PP | R1 | R2 | R3 |
|---|---|---|---|---|---|---|---|
| Standard | 19.767 | 20.143 | 20.387 | 20.763 | 21.007 | 21.383 | 21.627 |
| Camarilla | 20.460 | 20.516 | 20.573 | 20.630 | 20.687 | 20.744 | 20.801 |
| Woodie | 19.700 | 20.110 | 20.320 | 20.730 | 20.940 | 21.350 | 21.560 |
| Fibonacci | 20.143 | 20.380 | 20.527 | 20.763 | 21.000 | 21.147 | 21.383 |
| Pivot points | S3 | S2 | S1 | PP | R1 | R2 | R3 |
|---|---|---|---|---|---|---|---|
| Standard | 18.070 | 18.820 | 19.550 | 20.300 | 21.030 | 21.780 | 22.510 |
| Camarilla | 19.873 | 20.009 | 20.144 | 20.280 | 20.416 | 20.551 | 20.687 |
| Woodie | 18.060 | 18.815 | 19.540 | 20.295 | 21.020 | 21.775 | 22.500 |
| Fibonacci | 18.820 | 19.385 | 19.735 | 20.300 | 20.865 | 21.215 | 21.780 |
Numerical data
The following is the status of the technical indicators and moving averages at the time of publication of this technical analysis:
| RSI (14): | 42.44 | |
| MACD (12,26,9): | -0.0660 | |
| Directional Movement: | -10.984 | |
| AROON (14): | -57.143 | |
| DEMA (21): | 20.545 | |
| Parabolic SAR (0,02-0,02-0,2): | 20.759 | |
| Elder Ray (13): | -0.037 | |
| Super Trend (3,10): | 20.771 | |
| Zig ZAG (10): | 20.540 | |
| VORTEX (21): | 1.0050 | |
| Stochastique (14,3,5): | 22.22 | |
| TEMA (21): | 20.503 | |
| Williams %R (14): | -71.43 | |
| Chande Momentum Oscillator (20): | -0.080 | |
| Repulse (5,40,3): | -0.1580 | |
| ROCnROLL: | 2 | |
| TRIX (15,9): | -0.0420 | |
| Courbe Coppock: | 1.23 |
| MA7: | 20.763 | |
| MA20: | 20.382 | |
| MA50: | 20.056 | |
| MA100: | 19.542 | |
| MAexp7: | 20.552 | |
| MAexp20: | 20.628 | |
| MAexp50: | 20.680 | |
| MAexp100: | 20.615 | |
| Price / MA7: | -1.07% | |
| Price / MA20: | +0.78% | |
| Price / MA50: | +2.41% | |
| Price / MA100: | +5.11% | |
| Price / MAexp7: | -0.06% | |
| Price / MAexp20: | -0.43% | |
| Price / MAexp50: | -0.68% | |
| Price / MAexp100: | -0.36% |
News
Don't forget to follow the news on ENDESA. At the time of publication of this analysis, the latest news was as follows:
About author
Online


Add a comment
Comments
0 comments on the analysis ENDESA - 1H