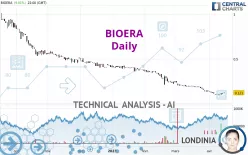
BIOERA - Daily - Technical analysis published on 04/19/2023 (GMT)
- 160
- 0
Click here for a new analysis!
- Timeframe : Daily
- - Analysis generated on
- Status : TARGET REACHED

Summary of the analysis
Additional analysis
Quotes
BIOERA rating 0.1210 EUR. On the day, this instrument gained +9.01% and was traded between 0.1110 EUR and 0.1210 EUR over the period. The price is currently at +9.01% from its lowest and 0% from its highest.A bullish opening was detected by the Central Gaps scanner. Buyers are trying to impose a bullish momentum in the very short term.
Bullish opening
Type : Bullish
Timeframe : Openning
Here is a more detailed summary of the historical variations registered by BIOERA:
Abnormal volumes
Timeframe : 5 days
Abnormal volumes
Timeframe : 20 days
Abnormal volumes
Timeframe : 50 days
Technical
Technical analysis of this Daily chart of BIOERA indicates that the overall trend is strongly bearish. 92.86% of the signals given by moving averages are bearish. This strongly bearish trend is supported by the strong bearish signals given by short-term moving averages. An assessment of moving averages reveals a bullish signal that could impact this trend:
Bullish price crossover with adaptative moving average 50
Type : Bullish
Timeframe : Daily
In fact, of the 18 technical indicators analysed by Central Analyzer, 8 are bullish, 5 are neutral and 5 are bearish. Central Indicators, the detector scanner for these technical indicators has recently detected several signals:
Pivot points : price is over resistance 2
Type : Neutral
Timeframe : Daily
Pivot points : price is over resistance 3
Type : Neutral
Timeframe : Weekly
Williams %R indicator is back over -50
Type : Bullish
Timeframe : Daily
Central Patterns, the scanner specializing in chart patterns, did not identify any signals.
The Central Candlesticks scanner, specialised in Japanese candlesticks, did not identify any signals.
| Price | R1 | R2 | R3 | |
|---|---|---|---|---|
| ProTrendLines | 0.1210 | 0.1930 | 0.4019 | 0.5800 |
| Change (%) | - | +59.50% | +232.15% | +379.34% |
| Change | - | +0.0720 | +0.2809 | +0.4590 |
| Level | - | Minor | Minor | Minor |
Attention could also be paid to pivot points to set price objectives:
| Pivot points | S3 | S2 | S1 | PP | R1 | R2 | R3 |
|---|---|---|---|---|---|---|---|
| Standard | 0.0957 | 0.1003 | 0.1057 | 0.1103 | 0.1157 | 0.1203 | 0.1257 |
| Camarilla | 0.1083 | 0.1092 | 0.1101 | 0.1110 | 0.1119 | 0.1128 | 0.1138 |
| Woodie | 0.0960 | 0.1005 | 0.1060 | 0.1105 | 0.1160 | 0.1205 | 0.1260 |
| Fibonacci | 0.1003 | 0.1042 | 0.1065 | 0.1103 | 0.1142 | 0.1165 | 0.1203 |
| Pivot points | S3 | S2 | S1 | PP | R1 | R2 | R3 |
|---|---|---|---|---|---|---|---|
| Standard | 0.0778 | 0.0847 | 0.0893 | 0.0962 | 0.1008 | 0.1077 | 0.1123 |
| Camarilla | 0.0908 | 0.0919 | 0.0930 | 0.0940 | 0.0951 | 0.0961 | 0.0972 |
| Woodie | 0.0768 | 0.0841 | 0.0883 | 0.0956 | 0.0998 | 0.1071 | 0.1113 |
| Fibonacci | 0.0847 | 0.0891 | 0.0918 | 0.0962 | 0.1006 | 0.1033 | 0.1077 |
| Pivot points | S3 | S2 | S1 | PP | R1 | R2 | R3 |
|---|---|---|---|---|---|---|---|
| Standard | -0.0243 | 0.0531 | 0.0946 | 0.1720 | 0.2135 | 0.2909 | 0.3324 |
| Camarilla | 0.1033 | 0.1142 | 0.1251 | 0.1360 | 0.1469 | 0.1578 | 0.1687 |
| Woodie | -0.0424 | 0.0441 | 0.0766 | 0.1630 | 0.1955 | 0.2819 | 0.3144 |
| Fibonacci | 0.0531 | 0.0986 | 0.1266 | 0.1720 | 0.2175 | 0.2455 | 0.2909 |
Numerical data
The following is the status of the technical indicators and moving averages at the time of publication of this technical analysis:
| RSI (14): | 33.54 | |
| MACD (12,26,9): | -0.0294 | |
| Directional Movement: | -22.0677 | |
| AROON (14): | -71.4286 | |
| DEMA (21): | 0.0929 | |
| Parabolic SAR (0,02-0,02-0,2): | 0.0920 | |
| Elder Ray (13): | -0.0045 | |
| Super Trend (3,10): | 0.1281 | |
| Zig ZAG (10): | 0.1210 | |
| VORTEX (21): | 0.6411 | |
| Stochastique (14,3,5): | 34.59 | |
| TEMA (21): | 0.0975 | |
| Williams %R (14): | -47.79 | |
| Chande Momentum Oscillator (20): | -0.0192 | |
| Repulse (5,40,3): | 16.8524 | |
| ROCnROLL: | -1 | |
| TRIX (15,9): | -2.5099 | |
| Courbe Coppock: | 66.71 |
| MA7: | 0.1049 | |
| MA20: | 0.1344 | |
| MA50: | 0.2058 | |
| MA100: | 0.3129 | |
| MAexp7: | 0.1121 | |
| MAexp20: | 0.1347 | |
| MAexp50: | 0.2031 | |
| MAexp100: | 0.3117 | |
| Price / MA7: | +15.35% | |
| Price / MA20: | -9.97% | |
| Price / MA50: | -41.21% | |
| Price / MA100: | -61.33% | |
| Price / MAexp7: | +7.94% | |
| Price / MAexp20: | -10.17% | |
| Price / MAexp50: | -40.42% | |
| Price / MAexp100: | -61.18% |
About author

Online


Add a comment
Comments
0 comments on the analysis BIOERA - Daily