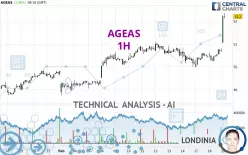
AGEAS - 1H - Technical analysis published on 02/19/2025 (GMT)
- 126
- 0
- Timeframe : 1H
- - Analysis generated on
- Status : WITHOUT TARGET

Summary of the analysis

Additional analysis
Quotes
The AGEAS rating is 52.20 EUR. The price registered an increase of +2.96% on the session and was traded between 51.05 EUR and 52.35 EUR over the period. The price is currently at +2.25% from its lowest and -0.29% from its highest.A bullish gap was detected at the opening by the Central Gaps scanner. There are a lot of buyers and they have the upper hand in the very short term.
Opening Gap UP
Type : Bullish
Timeframe : Openning
So that you have an overall view of the price change, here is a table showing the variations over several periods:
New HIGH record (5 years)
Type : Bullish
Timeframe : Weekly
New HIGH record (1 year)
Type : Bullish
Timeframe : Weekly
Near a new HIGH record (1 year)
Type : Bullish
Timeframe : Weekly
New HIGH record (1st january)
Type : Bullish
Timeframe : Weekly
Near a new HIGH record (1st january)
Type : Bullish
Timeframe : Weekly
New HIGH record (1 month)
Type : Bullish
Timeframe : Weekly
Technical
A technical analysis in 1H of this AGEAS chart shows a strongly bullish trend. 92.86% of the signals given by moving averages are bullish. The overall trend is supported by the strong bullish signals from short-term moving averages. The Central Indicators market scanner is currently detecting a bullish signal that could impact this trend:
Moving Average bullish crossovers : MA20 & MA50
Type : Bullish
Timeframe : 1 hour
The probability of a further increase is high given the direction of the technical indicators.
But beware of excesses. The Central Indicators scanner currently detects this:
RSI indicator is overbought : over 80
Type : Neutral
Timeframe : 1 hour
CCI indicator is overbought : over 100
Type : Neutral
Timeframe : 1 hour
Williams %R indicator is overbought : over -20
Type : Neutral
Timeframe : 1 hour
Pivot points : price is over resistance 3
Type : Neutral
Timeframe : 1 hour
Pivot points : price is over resistance 3
Type : Neutral
Timeframe : Weekly
Central Patterns, the market scanner focusing on chart patterns, resistances and supports found these results:
Near horizontal resistance
Type : Bearish
Timeframe : 1 hour
Resistance of channel is broken
Type : Bullish
Timeframe : 1 hour
The presence of these Japanese chandelier patterns detected by Central Candlesticks that could impact the current short-term trend were also noted:
Black gravestone / inverted hammer
Type : Bearish
Timeframe : 1 hour
Long white line
Type : Bullish
Timeframe : 1 hour
| S3 | S2 | S1 | Price | |
|---|---|---|---|---|
| ProTrendLines | 49.83 | 50.75 | 51.10 | 52.20 |
| Change (%) | -4.54% | -2.78% | -2.11% | - |
| Change | -2.37 | -1.45 | -1.10 | - |
| Level | Intermediate | Major | Intermediate | - |
Attention could also be paid to pivot points to set price objectives:
| Pivot points | S3 | S2 | S1 | PP | R1 | R2 | R3 |
|---|---|---|---|---|---|---|---|
| Standard | 49.82 | 50.03 | 50.37 | 50.58 | 50.92 | 51.13 | 51.47 |
| Camarilla | 50.55 | 50.60 | 50.65 | 50.70 | 50.75 | 50.80 | 50.85 |
| Woodie | 49.88 | 50.06 | 50.43 | 50.61 | 50.98 | 51.16 | 51.53 |
| Fibonacci | 50.03 | 50.24 | 50.37 | 50.58 | 50.79 | 50.92 | 51.13 |
| Pivot points | S3 | S2 | S1 | PP | R1 | R2 | R3 |
|---|---|---|---|---|---|---|---|
| Standard | 48.63 | 49.32 | 49.73 | 50.42 | 50.83 | 51.52 | 51.93 |
| Camarilla | 49.85 | 49.95 | 50.05 | 50.15 | 50.25 | 50.35 | 50.45 |
| Woodie | 48.50 | 49.25 | 49.60 | 50.35 | 50.70 | 51.45 | 51.80 |
| Fibonacci | 49.32 | 49.74 | 50.00 | 50.42 | 50.84 | 51.10 | 51.52 |
| Pivot points | S3 | S2 | S1 | PP | R1 | R2 | R3 |
|---|---|---|---|---|---|---|---|
| Standard | 43.56 | 44.82 | 47.32 | 48.58 | 51.08 | 52.34 | 54.84 |
| Camarilla | 48.79 | 49.13 | 49.48 | 49.82 | 50.17 | 50.51 | 50.85 |
| Woodie | 44.18 | 45.13 | 47.94 | 48.89 | 51.70 | 52.65 | 55.46 |
| Fibonacci | 44.82 | 46.26 | 47.14 | 48.58 | 50.02 | 50.90 | 52.34 |
Numerical data
The following is the status of technical indicators and moving averages registered at the time this technical analysis was created:
| RSI (14): | 82.39 | |
| MACD (12,26,9): | 0.2800 | |
| Directional Movement: | 43.51 | |
| AROON (14): | 64.29 | |
| DEMA (21): | 51.11 | |
| Parabolic SAR (0,02-0,02-0,2): | 50.36 | |
| Elder Ray (13): | 1.25 | |
| Super Trend (3,10): | 51.36 | |
| Zig ZAG (10): | 52.25 | |
| VORTEX (21): | 1.3500 | |
| Stochastique (14,3,5): | 91.52 | |
| TEMA (21): | 51.34 | |
| Williams %R (14): | -9.52 | |
| Chande Momentum Oscillator (20): | 1.65 | |
| Repulse (5,40,3): | 1.7500 | |
| ROCnROLL: | 1 | |
| TRIX (15,9): | 0.0200 | |
| Courbe Coppock: | 2.94 |
| MA7: | 50.77 | |
| MA20: | 49.99 | |
| MA50: | 48.35 | |
| MA100: | 47.61 | |
| MAexp7: | 51.28 | |
| MAexp20: | 50.84 | |
| MAexp50: | 50.61 | |
| MAexp100: | 50.31 | |
| Price / MA7: | +2.82% | |
| Price / MA20: | +4.42% | |
| Price / MA50: | +7.96% | |
| Price / MA100: | +9.64% | |
| Price / MAexp7: | +1.79% | |
| Price / MAexp20: | +2.68% | |
| Price / MAexp50: | +3.14% | |
| Price / MAexp100: | +3.76% |
News
Don't forget to follow the news on AGEAS. At the time of publication of this analysis, the latest news was as follows:
- Ageas reports on the progress of share buy-back programme
- Ageas reports on the progress of share buy-back programme
- Ageas reports on the progress of share buy-back programme
- Fosun Secures EUR670 Million for Completion of Ageas Sale
- Ageas reports on the progress of share buy-back programme
About author
Online


Add a comment
Comments
0 comments on the analysis AGEAS - 1H