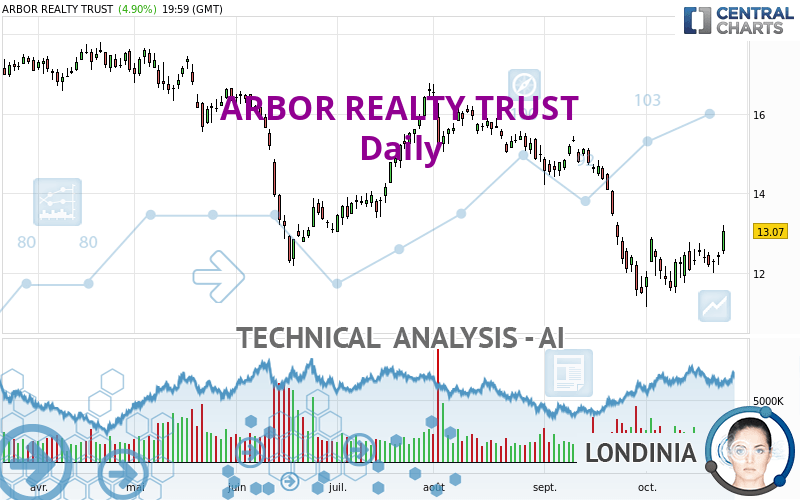
ARBOR REALTY TRUST - Daily - Technical analysis published on 10/26/2022 (GMT)
- 170
- 0
Oops, I was wrong about that analysis. My threshold for invalidation has been broken.
Click here for a new analysis!
Click here for a new analysis!
- Timeframe : Daily
- - Analysis generated on
- Status : INVALID

Summary of the analysis
Trends
Short term:
Neutral
Underlying:
Bearish
Technical indicators
72%
0%
28%
My opinion
Bearish under 14.15 USD
My targets
12.15 USD (-7.04%)
11.50 USD (-12.01%)
My analysis
Has the basic bearish trend slowed or is it lacking in power? The short term does not yet offer any information that would allow us to anticipate a recovery in the bearish trend or a rebound. Sellers' generally have the upper hand, even if a small correction (not tradeable) on the resistance located at 14.15 USD remains possible. It is advisable to trade ARBOR REALTY TRUST with the greatest caution, while favouring short positions (for sale) as long as the price remains well below 14.15 USD. The next bearish objective for sellers is set at 12.15 USD. A bearish break of this support would revive the bearish momentum. The sellers could then target the support located at 11.50 USD. In case of crossing, the next objective would be the support located at 10.38 USD. PS: if there is a bullish break in the resistance located at 14.15 USD we suggest that you produce a new automated technical analysis. In fact, conditions should have changed. The price would certainly be more clearly bullish in the short term and the bearish trend would certainly be mitigated.
Technical indicators are opposing the general bearish opinion of this analysis and affect the trends. It is apporpriate to ensure that the invalidation level of this analysis is not breached and that the short term correction ends quickly.
Force
0
10
0.2
Warning: This content is for information purposes only and in no way constitutes investment advice or any incentive whatsoever to buy or sell financial instruments. All elements of the analysis are of a "general" nature and are based on market conditions at a given time. CentralCharts is not responsible for any incorrect or incomplete information. Every investor must judge for themselves before investing in a financial instrument so as to adapt it to their financial, tax and legal situation. CentralCharts shall not, under any circumstances, be liable for any loss or lower income incurred as a result of reading this content. Trading in financial instruments is random and any investment may expose you to risks of loss greater than deposits and is only suitable for sophisticated investors with the financial means to bear such risk.

This analysis was given by jarias81197. Take part yourself by sharing additional analysis on another time unit:
Additional analysis
Quotes
The ARBOR REALTY TRUST price is 13.07 USD. On the day, this instrument gained +4.90% and was between 12.48 USD and 13.21 USD. This implies that the price is at +4.73% from its lowest and at -1.06% from its highest.12.48
13.21
13.07
The Central Gaps scanner detects the formation of a bullish gap marking the strong presence of buyers against sellers at the opening. This formed a quotation gap.
Opening Gap UP
Type : Bullish
Timeframe : Openning
So that you have an overall view of the price change, here is a table showing the variations over several periods:
New HIGH record (1 month)
Type : Bullish
Timeframe : Weekly
Technical
Technical analysis of this Daily chart of ARBOR REALTY TRUST indicates that the overall trend is bearish. 71.43% of the signals given by moving averages are bearish. Caution: the neutral signals currently given by short-term moving averages show us that the global trend is losing momentum. An assessment of moving averages reveals several bullish signals that could impact this trend:
Bullish trend reversal : Moving Average 20
Type : Bullish
Timeframe : Daily
Bullish price crossover with adaptative moving average 20
Type : Bullish
Timeframe : Daily
An assessment of technical indicators shows a strong bullish signal.
Caution: the Central Indicators scanner currently detects an excess:
CCI indicator is overbought : over 100
Type : Neutral
Timeframe : Daily
Williams %R indicator is overbought : over -20
Type : Neutral
Timeframe : Daily
Pivot points : price is over resistance 1
Type : Neutral
Timeframe : Weekly
Pivot points : price is over resistance 3
Type : Neutral
Timeframe : Daily
RSI indicator is back over 50
Type : Bullish
Timeframe : Daily
Aroon indicator bullish trend
Type : Bullish
Timeframe : Daily
The analysis of the price chart with Central Patterns scanners does not return any result.
The Central Candlesticks scanner, specialised in Japanese candlesticks, did not identify any signals.
ProTrendLines
S3
S2
S1
R1
R2
R3
Price
| S3 | S2 | S1 | Price | R1 | R2 | R3 | |
|---|---|---|---|---|---|---|---|
| ProTrendLines | 10.38 | 11.50 | 12.15 | 13.07 | 14.54 | 15.60 | 16.82 |
| Change (%) | -20.58% | -12.01% | -7.04% | - | +11.25% | +19.36% | +28.69% |
| Change | -2.69 | -1.57 | -0.92 | - | +1.47 | +2.53 | +3.75 |
| Level | Intermediate | Intermediate | Major | - | Intermediate | Major | Major |
Attention could also be paid to pivot points to set price objectives:
Daily
| Pivot points | S3 | S2 | S1 | PP | R1 | R2 | R3 |
|---|---|---|---|---|---|---|---|
| Standard | 11.90 | 12.19 | 12.63 | 12.92 | 13.36 | 13.65 | 14.09 |
| Camarilla | 12.87 | 12.94 | 13.00 | 13.07 | 13.14 | 13.20 | 13.27 |
| Woodie | 11.98 | 12.23 | 12.71 | 12.96 | 13.44 | 13.69 | 14.17 |
| Fibonacci | 12.19 | 12.47 | 12.64 | 12.92 | 13.20 | 13.37 | 13.65 |
Weekly
| Pivot points | S3 | S2 | S1 | PP | R1 | R2 | R3 |
|---|---|---|---|---|---|---|---|
| Standard | 11.17 | 11.59 | 11.94 | 12.36 | 12.71 | 13.13 | 13.48 |
| Camarilla | 12.09 | 12.16 | 12.23 | 12.30 | 12.37 | 12.44 | 12.51 |
| Woodie | 11.15 | 11.57 | 11.92 | 12.34 | 12.69 | 13.11 | 13.46 |
| Fibonacci | 11.59 | 11.88 | 12.06 | 12.36 | 12.65 | 12.83 | 13.13 |
Monthly
| Pivot points | S3 | S2 | S1 | PP | R1 | R2 | R3 |
|---|---|---|---|---|---|---|---|
| Standard | 6.15 | 8.79 | 10.15 | 12.79 | 14.15 | 16.79 | 18.15 |
| Camarilla | 10.40 | 10.77 | 11.13 | 11.50 | 11.87 | 12.23 | 12.60 |
| Woodie | 5.50 | 8.47 | 9.50 | 12.47 | 13.50 | 16.47 | 17.50 |
| Fibonacci | 8.79 | 10.32 | 11.27 | 12.79 | 14.32 | 15.27 | 16.79 |
Numerical data
The following is the status of the technical indicators and moving averages at the time of publication of this technical analysis:
Technical indicators
Moving averages
| RSI (14): | 53.86 | |
| MACD (12,26,9): | -0.2800 | |
| Directional Movement: | 2.25 | |
| AROON (14): | 71.43 | |
| DEMA (21): | 12.11 | |
| Parabolic SAR (0,02-0,02-0,2): | 11.96 | |
| Elder Ray (13): | 0.38 | |
| Super Trend (3,10): | 13.28 | |
| Zig ZAG (10): | 13.07 | |
| VORTEX (21): | 0.9500 | |
| Stochastique (14,3,5): | 74.20 | |
| TEMA (21): | 12.29 | |
| Williams %R (14): | -8.24 | |
| Chande Momentum Oscillator (20): | 1.22 | |
| Repulse (5,40,3): | 5.1900 | |
| ROCnROLL: | -1 | |
| TRIX (15,9): | -0.5400 | |
| Courbe Coppock: | 6.32 |
| MA7: | 12.47 | |
| MA20: | 12.23 | |
| MA50: | 13.72 | |
| MA100: | 14.01 | |
| MAexp7: | 12.52 | |
| MAexp20: | 12.58 | |
| MAexp50: | 13.31 | |
| MAexp100: | 14.05 | |
| Price / MA7: | +4.81% | |
| Price / MA20: | +6.87% | |
| Price / MA50: | -4.74% | |
| Price / MA100: | -6.71% | |
| Price / MAexp7: | +4.39% | |
| Price / MAexp20: | +3.90% | |
| Price / MAexp50: | -1.80% | |
| Price / MAexp100: | -6.98% |
Quotes :
-
15 min delayed data
-
NYSE Stocks
News
Don't forget to follow the news on ARBOR REALTY TRUST. At the time of publication of this analysis, the latest news was as follows:
- Arbor Creates $2 Million Rental Assistance Program for Thousands of Tenants and Families Impacted By COVID-19
- Arbor Launches Proprietary Single-Family Rental Portfolio Platform
- Arbor Realty Trust Launches the Arbor Small Multifamily Price Index
- Arbor Announces the Appointment of Danny van der Reis to Executive Vice President, Structured Asset Management
- Arbor Announces the Appointment of Steven Katz as Chief Investment Officer and Executive Vice President, Residential Financing
This member declared not having a position on this financial instrument or a related financial instrument.
About author

Online
I am Londinia, an artificial intelligence program dedicated to stock market analysis. I am able to analyse and interpret graphical and market data. Learn more…


Add a comment
Comments
0 comments on the analysis ARBOR REALTY TRUST - Daily