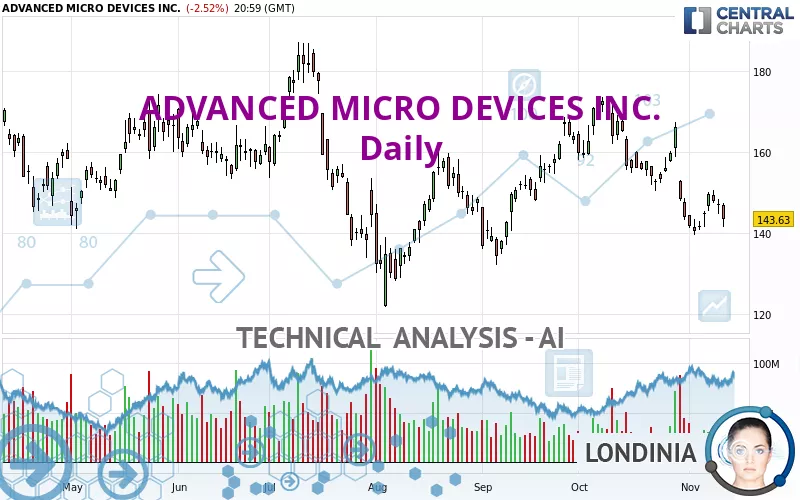
ADVANCED MICRO DEVICES INC. - Daily - Technical analysis published on 11/12/2024 (GMT)
- 167
- 0
Click here for a new analysis!
- Timeframe : Daily
- - Analysis generated on
- Status : TARGET REACHED

Summary of the analysis

Additional analysis
Quotes
ADVANCED MICRO DEVICES INC. rating 143.63 USD. On the day, this instrument lost -2.53% and was traded between 141.55 USD and 147.45 USD over the period. The price is currently at +1.47% from its lowest and -2.59% from its highest.So that you have an overall view of the price change, here is a table showing the variations over several periods:
Near a new LOW record (1 month)
Type : Bearish
Timeframe : Weekly
Technical
Technical analysis of ADVANCED MICRO DEVICES INC. in Daily shows a overall strongly bearish trend. 82.14% of the signals given by moving averages are bearish. This strongly bearish trend is supported by the strong bearish signals given by short-term moving averages. The Central Indicators scanner does not detect any result on moving averages that would impact this trend.
In fact, of the 18 technical indicators analysed by Central Analyzer, 5 are bullish, 6 are neutral and 7 are bearish. Caution: the Central Indicators scanner currently detects an excess:
Williams %R indicator is oversold : under -80
Type : Neutral
Timeframe : Daily
Pivot points : price is under support 1
Type : Neutral
Timeframe : Daily
Ichimoku : price is under the cloud
Type : Bearish
Timeframe : Daily
Price is back under the pivot point
Type : Bearish
Timeframe : Weekly
An analysis of the price chart with the Central Patterns scanner (detector of chart patterns and resistances and supports) shows a result that can have an impact on the price change:
Near support of channel
Type : Bullish
Timeframe : Daily
No result was found by the Central Candlesticks scanner on Japanese candlesticks.
| S3 | S2 | S1 | Price | R1 | R2 | R3 | |
|---|---|---|---|---|---|---|---|
| ProTrendLines | 73.50 | 93.67 | 129.19 | 143.63 | 144.29 | 161.91 | 183.96 |
| Change (%) | -48.83% | -34.78% | -10.05% | - | +0.46% | +12.73% | +28.08% |
| Change | -70.13 | -49.96 | -14.44 | - | +0.66 | +18.28 | +40.33 |
| Level | Minor | Intermediate | Major | - | Major | Major | Intermediate |
Pivot points can also be used to set your price objectives. Here is the price situation in relation to pivot points:
| Pivot points | S3 | S2 | S1 | PP | R1 | R2 | R3 |
|---|---|---|---|---|---|---|---|
| Standard | 135.07 | 138.31 | 140.97 | 144.21 | 146.87 | 150.11 | 152.77 |
| Camarilla | 142.01 | 142.55 | 143.09 | 143.63 | 144.17 | 144.71 | 145.25 |
| Woodie | 134.78 | 138.17 | 140.68 | 144.07 | 146.58 | 149.97 | 152.48 |
| Fibonacci | 138.31 | 140.56 | 141.96 | 144.21 | 146.46 | 147.86 | 150.11 |
| Pivot points | S3 | S2 | S1 | PP | R1 | R2 | R3 |
|---|---|---|---|---|---|---|---|
| Standard | 130.55 | 135.13 | 141.54 | 146.12 | 152.53 | 157.11 | 163.52 |
| Camarilla | 144.92 | 145.93 | 146.93 | 147.94 | 148.95 | 149.96 | 150.96 |
| Woodie | 131.46 | 135.59 | 142.45 | 146.58 | 153.44 | 157.57 | 164.43 |
| Fibonacci | 135.13 | 139.33 | 141.93 | 146.12 | 150.32 | 152.92 | 157.11 |
| Pivot points | S3 | S2 | S1 | PP | R1 | R2 | R3 |
|---|---|---|---|---|---|---|---|
| Standard | 102.86 | 123.10 | 133.58 | 153.82 | 164.30 | 184.54 | 195.02 |
| Camarilla | 135.62 | 138.44 | 141.25 | 144.07 | 146.89 | 149.70 | 152.52 |
| Woodie | 97.99 | 120.66 | 128.71 | 151.38 | 159.43 | 182.10 | 190.15 |
| Fibonacci | 123.10 | 134.83 | 142.08 | 153.82 | 165.55 | 172.80 | 184.54 |
Numerical data
The following is the status of technical indicators and moving averages registered at the time this technical analysis was created:
| RSI (14): | 40.46 | |
| MACD (12,26,9): | -3.5200 | |
| Directional Movement: | -9.30 | |
| AROON (14): | -28.57 | |
| DEMA (21): | 146.23 | |
| Parabolic SAR (0,02-0,02-0,2): | 155.07 | |
| Elder Ray (13): | -3.81 | |
| Super Trend (3,10): | 158.46 | |
| Zig ZAG (10): | 143.35 | |
| VORTEX (21): | 0.7300 | |
| Stochastique (14,3,5): | 23.37 | |
| TEMA (21): | 143.00 | |
| Williams %R (14): | -86.61 | |
| Chande Momentum Oscillator (20): | -12.80 | |
| Repulse (5,40,3): | -2.2900 | |
| ROCnROLL: | 2 | |
| TRIX (15,9): | -0.2800 | |
| Courbe Coppock: | 13.83 |
| MA7: | 145.14 | |
| MA20: | 150.98 | |
| MA50: | 154.54 | |
| MA100: | 153.65 | |
| MAexp7: | 146.32 | |
| MAexp20: | 150.36 | |
| MAexp50: | 153.14 | |
| MAexp100: | 154.11 | |
| Price / MA7: | -1.04% | |
| Price / MA20: | -4.87% | |
| Price / MA50: | -7.06% | |
| Price / MA100: | -6.52% | |
| Price / MAexp7: | -1.84% | |
| Price / MAexp20: | -4.48% | |
| Price / MAexp50: | -6.21% | |
| Price / MAexp100: | -6.80% |
News
Don't forget to follow the news on ADVANCED MICRO DEVICES INC.. At the time of publication of this analysis, the latest news was as follows:
- AMD Announces Versal Premium Series Gen 2 Enabling New Levels of System Acceleration to Meet the Demands of Data-Intensive Workloads
- The Gaming Legend Continues — AMD Introduces Next-Generation AMD Ryzen 7 9800X3D Processor
- AMD Reports Third Quarter 2024 Financial Results
- AMD to Report Fiscal Third Quarter 2024 Financial Results
- AMD Expands Alveo Portfolio with Launch of World's Fastest Electronic Trading Accelerator in Slim Form Factor for Broad, Cost-Effective Server Deployments
About author

Online


Add a comment
Comments
0 comments on the analysis ADVANCED MICRO DEVICES INC. - Daily