ATLANTA BRAVES HLD. - Daily - Technical analysis published on 10/03/2019 (GMT)
- 129
- 0
- Who voted?
Click here for a new analysis!
- Timeframe : Daily
- - Analysis generated on
- Status : TARGET REACHED

Summary of the analysis

Additional analysis
Quotes
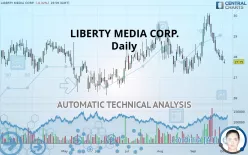
LIBERTY MEDIA CORP. rating 27.75 USD. On the day, this instrument lost -0.32% with the lowest point at 27.65 USD and the highest point at 27.87 USD. The deviation from the price is +0.36% for the low point and -0.43% for the high point.A bearish gap was detected at the opening by the Central Gaps scanner. There are a lot of sellers and they have the upper hand in the very short term.
Opening Gap DOWN
Type : Bearish
Timeframe : Openning
Here is a more detailed summary of the historical variations registered by LIBERTY MEDIA CORP.:
Near a new LOW record (1 month)
Type : Bearish
Timeframe : Weekly
Technical
Technical analysis of this Daily chart of LIBERTY MEDIA CORP. indicates that the overall trend is slightly bearish. 60.71% of the signals given by moving averages are bearish. This slightly bearish trend could be reinforced by the strong bearish signals given by short-term moving averages. There is no crossing of moving average by the price or crossing of moving averages between themselves.
In fact, 11 technical indicators on 18 studied are currently positioned bearish. Caution: the Central Indicators scanner currently detects an excess:
Williams %R indicator is oversold : under -80
Type : Neutral
Timeframe : Daily
Aroon indicator bearish trend
Type : Bearish
Timeframe : Daily
MACD indicator is back under 0
Type : Bearish
Timeframe : Daily
Price is back under the pivot point
Type : Bearish
Timeframe : Daily
Price is back under the pivot point
Type : Bearish
Timeframe : Weekly
Central Patterns, the scanner specializing in chart patterns, did not identify any signals.
The Central Candlesticks scanner which studies Japanese candlesticks did not detect anything.
| S3 | S2 | S1 | Price | R1 | R2 | |
|---|---|---|---|---|---|---|
| ProTrendLines | 25.40 | 26.34 | 27.27 | 27.75 | 28.63 | 29.51 |
| Change (%) | -8.47% | -5.08% | -1.73% | - | +3.17% | +6.34% |
| Change | -2.35 | -1.41 | -0.48 | - | +0.88 | +1.76 |
| Level | Minor | Major | Major | - | Intermediate | Major |
Pivot points can also be used to set your price objectives. Here is the price situation in relation to pivot points:
| Pivot points | S3 | S2 | S1 | PP | R1 | R2 | R3 |
|---|---|---|---|---|---|---|---|
| Standard | 27.15 | 27.47 | 27.65 | 27.97 | 28.15 | 28.47 | 28.65 |
| Camarilla | 27.70 | 27.75 | 27.79 | 27.84 | 27.89 | 27.93 | 27.98 |
| Woodie | 27.09 | 27.44 | 27.59 | 27.94 | 28.09 | 28.44 | 28.59 |
| Fibonacci | 27.47 | 27.66 | 27.78 | 27.97 | 28.16 | 28.28 | 28.47 |
| Pivot points | S3 | S2 | S1 | PP | R1 | R2 | R3 |
|---|---|---|---|---|---|---|---|
| Standard | 26.18 | 27.00 | 27.49 | 28.31 | 28.80 | 29.62 | 30.11 |
| Camarilla | 27.61 | 27.73 | 27.85 | 27.97 | 28.09 | 28.21 | 28.33 |
| Woodie | 26.01 | 26.92 | 27.32 | 28.23 | 28.63 | 29.54 | 29.94 |
| Fibonacci | 27.00 | 27.50 | 27.81 | 28.31 | 28.81 | 29.12 | 29.62 |
| Pivot points | S3 | S2 | S1 | PP | R1 | R2 | R3 |
|---|---|---|---|---|---|---|---|
| Standard | 23.89 | 25.59 | 26.71 | 28.41 | 29.53 | 31.23 | 32.35 |
| Camarilla | 27.06 | 27.31 | 27.57 | 27.83 | 28.09 | 28.35 | 28.61 |
| Woodie | 23.60 | 25.45 | 26.42 | 28.27 | 29.24 | 31.09 | 32.06 |
| Fibonacci | 25.59 | 26.67 | 27.33 | 28.41 | 29.49 | 30.15 | 31.23 |
Numerical data
The following is the status of technical indicators and moving averages registered at the time this technical analysis was created:
| RSI (14): | 40.29 | |
| MACD (12,26,9): | -0.0900 | |
| Directional Movement: | -2.50 | |
| AROON (14): | -78.57 | |
| DEMA (21): | 28.29 | |
| Parabolic SAR (0,02-0,02-0,2): | 29.31 | |
| Elder Ray (13): | -0.50 | |
| Super Trend (3,10): | 29.25 | |
| Zig ZAG (10): | 27.75 | |
| VORTEX (21): | 1.0200 | |
| Stochastique (14,3,5): | 2.36 | |
| TEMA (21): | 28.10 | |
| Williams %R (14): | -95.93 | |
| Chande Momentum Oscillator (20): | -1.86 | |
| Repulse (5,40,3): | -1.9400 | |
| ROCnROLL: | 2 | |
| TRIX (15,9): | 0.0500 | |
| Courbe Coppock: | 4.13 |
| MA7: | 28.01 | |
| MA20: | 28.56 | |
| MA50: | 28.33 | |
| MA100: | 27.82 | |
| MAexp7: | 28.06 | |
| MAexp20: | 28.33 | |
| MAexp50: | 28.24 | |
| MAexp100: | 28.02 | |
| Price / MA7: | -0.93% | |
| Price / MA20: | -2.84% | |
| Price / MA50: | -2.05% | |
| Price / MA100: | -0.25% | |
| Price / MAexp7: | -1.10% | |
| Price / MAexp20: | -2.05% | |
| Price / MAexp50: | -1.74% | |
| Price / MAexp100: | -0.96% |
About author

Online


Add a comment
Comments
0 comments on the analysis ATLANTA BRAVES HLD. - Daily