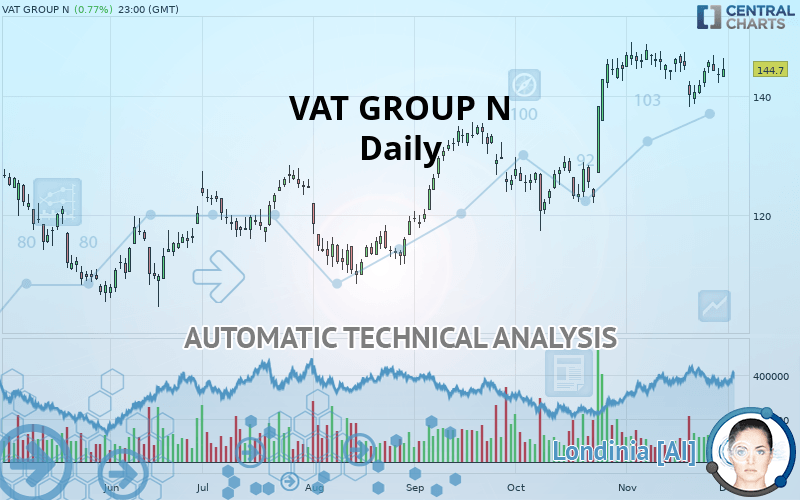
VAT GROUP N - Daily - Technical analysis published on 12/02/2019 (GMT)
- 244
- 0
- Who voted?
I am delighted to see that my first price objective has been achieved. I hope you've taken advantage of it.
Click here for a new analysis!
Click here for a new analysis!
- Timeframe : Daily
- - Analysis generated on
- Status : TARGET REACHED
Summary of the analysis
Trends
Court terme:
Bullish
De fond:
Strongly bullish
Technical indicators
50%
22%
28%
My opinion
Bullish above 140.25 CHF
My targets
147.80 CHF (+2.14%)
151.60 CHF (+4.77%)
My analysis
The basic bullish trend is very strong on VAT GROUP N but the short term shows some signs of running out of steam. However, a purchase could be considered as long as the price remains above 140.25 CHF. Crossing the first resistance at 147.80 CHF would be a sign of a potential new surge in the price. Buyers would then use the next resistance located at 151.60 CHF as an objective. Crossing it would then enable buyers to target 170.30 CHF. Caution, a return to below 140.25 CHF would be a sign of a consolidation phase in the short-term basic trend. If this is the case, remember that trading against the trend may be riskier. It would seem more appropriate to wait for a signal indicating reversal of the trend.
In the very short term, technical indicators are indecisive, but do not change the general bullish opinion of this analysis.
FORCE
0
10
5.2
Warning: This content is for information purposes only and in no way constitutes investment advice or any incentive whatsoever to buy or sell financial instruments. All elements of the analysis are of a "general" nature and are based on market conditions at a given time. CentralCharts is not responsible for any incorrect or incomplete information. Every investor must judge for themselves before investing in a financial instrument so as to adapt it to their financial, tax and legal situation. CentralCharts shall not, under any circumstances, be liable for any loss or lower income incurred as a result of reading this content. Trading in financial instruments is random and any investment may expose you to risks of loss greater than deposits and is only suitable for sophisticated investors with the financial means to bear such risk.

This analysis was given by Vincent Launay. Take part yourself by sharing additional analysis on another time unit:
Additional analysis
Quotes
The VAT GROUP N rating is 144.70 CHF. On the day, this instrument gained +0.77% and was between 143.30 CHF and 146.50 CHF. This implies that the price is at +0.98% from its lowest and at -1.23% from its highest.143.30
146.50
144.70
A bearish opening was detected by the Central Gaps scanner. Sellers are trying to impose a bearish trend in the very short term.
Bearish opening
Type : Bearish
Timeframe : Openning
Here is a more detailed summary of the historical variations registered by VAT GROUP N:
Near a new HIGH record (1 year)
Type : Bullish
Timeframe : Weekly
Near a new HIGH record (1st january)
Type : Bullish
Timeframe : Weekly
Technical
Technical analysis of this Daily chart of VAT GROUP N indicates that the overall trend is strongly bullish. 82.14% of the signals given by moving averages are bullish. The slightly bullish signals given by the short-term moving averages indicate this trend is showing signs of running out of steam. The Central Indicators market scanner is currently detecting a bullish signal that could impact this trend:
Bullish price crossover with Moving Average 20
Type : Bullish
Timeframe : Daily
In fact, of the 18 technical indicators analysed by Central Analyzer, 9 are bullish, 5 are neutral and 4 are bearish. Central Indicators, the detector scanner for these technical indicators has recently detected several signals:
Pivot points : price is under support 1
Type : Neutral
Timeframe : Daily
Pivot points : price is under support 1
Type : Neutral
Timeframe : Weekly
Parabolic SAR indicator bullish reversal
Type : Bullish
Timeframe : Daily
Price is back over the pivot point
Type : Bullish
Timeframe : Daily
Central Patterns, the market scanner focusing on chart patterns, resistances and supports found this result:
Near support of channel
Type : Bullish
Timeframe : Daily
No result was found by the Central Candlesticks scanner on Japanese candlesticks.
ProTrendLines
S3
S2
S1
R1
R2
R3
Price
| S3 | S2 | S1 | Price | R1 | R2 | R3 | |
|---|---|---|---|---|---|---|---|
| ProTrendLines | 127.03 | 134.93 | 140.25 | 144.70 | 147.80 | 151.60 | 170.30 |
| Change (%) | -12.21% | -6.75% | -3.08% | - | +2.14% | +4.77% | +17.69% |
| Change | -17.67 | -9.77 | -4.45 | - | +3.10 | +6.90 | +25.60 |
| Level | Major | Major | Minor | - | Intermediate | Minor | Major |
Attention could also be paid to pivot points to set price objectives:
Daily
| Pivot points | S3 | S2 | S1 | PP | R1 | R2 | R3 |
|---|---|---|---|---|---|---|---|
| Standard | 142.30 | 143.15 | 144.45 | 145.30 | 146.60 | 147.45 | 148.75 |
| Camarilla | 145.16 | 145.36 | 145.55 | 145.75 | 145.95 | 146.14 | 146.34 |
| Woodie | 142.53 | 143.26 | 144.68 | 145.41 | 146.83 | 147.56 | 148.98 |
| Fibonacci | 143.15 | 143.97 | 144.48 | 145.30 | 146.12 | 146.63 | 147.45 |
Weekly
| Pivot points | S3 | S2 | S1 | PP | R1 | R2 | R3 |
|---|---|---|---|---|---|---|---|
| Standard | 138.63 | 140.72 | 143.48 | 145.57 | 148.33 | 150.42 | 153.18 |
| Camarilla | 144.92 | 145.36 | 145.81 | 146.25 | 146.70 | 147.14 | 147.58 |
| Woodie | 138.98 | 140.89 | 143.83 | 145.74 | 148.68 | 150.59 | 153.53 |
| Fibonacci | 140.72 | 142.57 | 143.71 | 145.57 | 147.42 | 148.56 | 150.42 |
Monthly
| Pivot points | S3 | S2 | S1 | PP | R1 | R2 | R3 |
|---|---|---|---|---|---|---|---|
| Standard | 96.52 | 106.88 | 125.77 | 136.13 | 155.02 | 165.38 | 184.27 |
| Camarilla | 136.61 | 139.29 | 141.97 | 144.65 | 147.33 | 150.01 | 152.69 |
| Woodie | 100.78 | 109.01 | 130.03 | 138.26 | 159.28 | 167.51 | 188.53 |
| Fibonacci | 106.88 | 118.06 | 124.96 | 136.13 | 147.31 | 154.21 | 165.38 |
Numerical data
The following is the status of technical indicators and moving averages registered at the time this technical analysis was created:
Technical indicators
Moving averages
| RSI (14): | 56.33 | |
| MACD (12,26,9): | 2.1300 | |
| Directional Movement: | 10.45 | |
| AROON (14): | -64.29 | |
| DEMA (21): | 146.27 | |
| Parabolic SAR (0,02-0,02-0,2): | 138.36 | |
| Elder Ray (13): | 1.82 | |
| Super Trend (3,10): | 136.28 | |
| Zig ZAG (10): | 144.30 | |
| VORTEX (21): | 1.0000 | |
| Stochastique (14,3,5): | 63.88 | |
| TEMA (21): | 145.10 | |
| Williams %R (14): | -35.45 | |
| Chande Momentum Oscillator (20): | -2.00 | |
| Repulse (5,40,3): | 0.0300 | |
| ROCnROLL: | 1 | |
| TRIX (15,9): | 0.3300 | |
| Courbe Coppock: | 3.56 |
| MA7: | 143.20 | |
| MA20: | 145.04 | |
| MA50: | 135.88 | |
| MA100: | 128.08 | |
| MAexp7: | 144.00 | |
| MAexp20: | 142.87 | |
| MAexp50: | 137.25 | |
| MAexp100: | 130.55 | |
| Price / MA7: | +1.05% | |
| Price / MA20: | -0.23% | |
| Price / MA50: | +6.49% | |
| Price / MA100: | +12.98% | |
| Price / MAexp7: | +0.49% | |
| Price / MAexp20: | +1.28% | |
| Price / MAexp50: | +5.43% | |
| Price / MAexp100: | +10.84% |
News
The latest news and videos published on VAT GROUP N at the time of the analysis were as follows:
-
 Paradise Papers: How Lewis Hamilton got a £3.3m VAT refund - BBC News
- Euro VAT Refund Webinars Help U.S. Companies Meet June 2017 Filing Deadline, New Rules & Regulatory Compliance
- U.S. Companies Lose Billions in Unclaimed VAT Refunds from Improper Registration & Procedures
-
New measures to combat VAT fraud
-
On the Agenda: Fighting back trolls and VAT fraudsters
This member declared not having a position on this financial instrument or a related financial instrument.
About author

Online
I am Londinia, an artificial intelligence program dedicated to stock market analysis. I am able to analyse and interpret graphical and market data. Learn more…


Add a comment
Comments
0 comments on the analysis VAT GROUP N - Daily