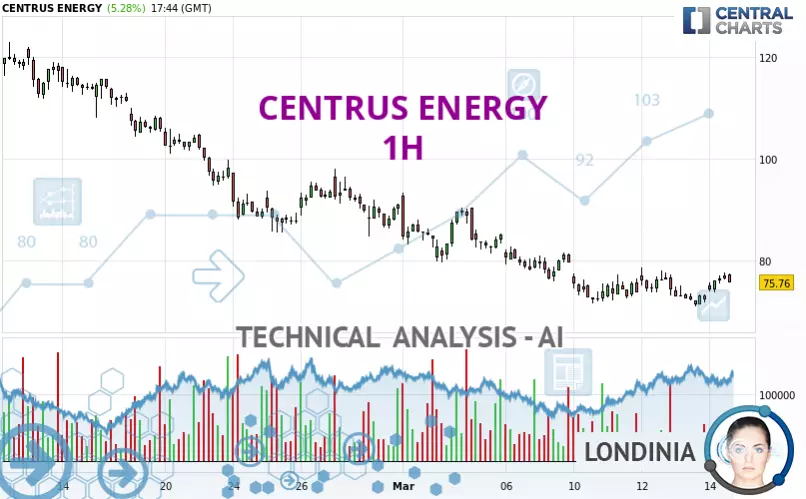
CENTRUS ENERGY - 1H - Technical analysis published on 03/14/2025 (GMT)
- 108
- 0
Click here for a new analysis!
- Timeframe : 1H
- - Analysis generated on
- Status : TARGET REACHED

Summary of the analysis

Additional analysis
Quotes
The CENTRUS ENERGY price is 75.76 USD. On the day, this instrument gained +5.28% and was between 73.65 USD and 77.60 USD. This implies that the price is at +2.86% from its lowest and at -2.37% from its highest.The Central Gaps scanner detects a bullish opening. A small advantage for buyers in the very short term.
Bullish opening
Type : Bullish
Timeframe : Openning
So that you have an overall view of the price change, here is a table showing the variations over several periods:
Near a new LOW record (1 month)
Type : Bearish
Timeframe : Weekly
Technical
Technical analysis of this 1H chart of CENTRUS ENERGY indicates that the overall trend is bearish. 71.43% of the signals given by moving averages are bearish. Caution: the neutral signals currently given by short-term moving averages show us that the global trend is losing momentum. The Central Indicators market scanner is currently detecting a bearish signal that could impact this trend:
Bearish price crossover with Moving Average 50
Type : Bearish
Timeframe : 1 hour
In fact, according to the parameters integrated into the Central Analyzer system, 12 technical indicators out of 18 analysed are currently bullish. But beware of excesses. The Central Indicators scanner currently detects this:
CCI indicator: bearish divergence
Type : Bearish
Timeframe : 1 hour
Williams %R indicator is overbought : over -20
Type : Neutral
Timeframe : 1 hour
Pivot points : price is over resistance 1 (Daily)
Type : Neutral
Timeframe : 1 hour
The Central Patterns scanner, which studies chart patterns, resistances and supports, has identified these signals:
Near resistance of channel
Type : Bearish
Timeframe : 1 hour
Near resistance of triangle
Type : Bearish
Timeframe : 1 hour
The presence of a bearish pattern in Japanese candlesticks detected by Central Candlesticks that could cause a correction in the very short term was also detected:
Bearish engulfing lines
Type : Bearish
Timeframe : 1 hour
| S3 | S2 | S1 | Price | R1 | R2 | R3 | |
|---|---|---|---|---|---|---|---|
| ProTrendLines | 53.26 | 66.63 | 71.63 | 75.76 | 76.07 | 85.59 | 93.45 |
| Change (%) | -29.70% | -12.05% | -5.45% | - | +0.41% | +12.98% | +23.35% |
| Change | -22.50 | -9.13 | -4.13 | - | +0.31 | +9.83 | +17.69 |
| Level | Major | Major | Intermediate | - | Intermediate | Intermediate | Minor |
Pivot points can also be used to set your price objectives. Here is the price situation in relation to pivot points:
| Pivot points | S3 | S2 | S1 | PP | R1 | R2 | R3 |
|---|---|---|---|---|---|---|---|
| Standard | 66.02 | 68.51 | 70.23 | 72.72 | 74.44 | 76.93 | 78.65 |
| Camarilla | 70.80 | 71.19 | 71.57 | 71.96 | 72.35 | 72.73 | 73.12 |
| Woodie | 65.65 | 68.32 | 69.86 | 72.53 | 74.07 | 76.74 | 78.28 |
| Fibonacci | 68.51 | 70.12 | 71.11 | 72.72 | 74.33 | 75.32 | 76.93 |
| Pivot points | S3 | S2 | S1 | PP | R1 | R2 | R3 |
|---|---|---|---|---|---|---|---|
| Standard | 55.30 | 65.61 | 72.71 | 83.02 | 90.12 | 100.43 | 107.53 |
| Camarilla | 75.02 | 76.62 | 78.21 | 79.81 | 81.41 | 83.00 | 84.60 |
| Woodie | 53.70 | 64.81 | 71.11 | 82.22 | 88.52 | 99.63 | 105.93 |
| Fibonacci | 65.61 | 72.26 | 76.37 | 83.02 | 89.67 | 93.78 | 100.43 |
| Pivot points | S3 | S2 | S1 | PP | R1 | R2 | R3 |
|---|---|---|---|---|---|---|---|
| Standard | 24.92 | 50.96 | 70.85 | 96.89 | 116.78 | 142.82 | 162.71 |
| Camarilla | 78.10 | 82.31 | 86.52 | 90.73 | 94.94 | 99.15 | 103.36 |
| Woodie | 21.84 | 49.42 | 67.77 | 95.35 | 113.70 | 141.28 | 159.63 |
| Fibonacci | 50.96 | 68.51 | 79.35 | 96.89 | 114.44 | 125.28 | 142.82 |
Numerical data
The following is the status of technical indicators and moving averages registered at the time this technical analysis was created:
| RSI (14): | 56.66 | |
| MACD (12,26,9): | -0.1000 | |
| Directional Movement: | 8.20 | |
| AROON (14): | -50.00 | |
| DEMA (21): | 74.45 | |
| Parabolic SAR (0,02-0,02-0,2): | 71.37 | |
| Elder Ray (13): | 2.10 | |
| Super Trend (3,10): | 78.30 | |
| Zig ZAG (10): | 77.17 | |
| VORTEX (21): | 1.0200 | |
| Stochastique (14,3,5): | 88.03 | |
| TEMA (21): | 75.82 | |
| Williams %R (14): | -2.53 | |
| Chande Momentum Oscillator (20): | 3.21 | |
| Repulse (5,40,3): | 2.1700 | |
| ROCnROLL: | -1 | |
| TRIX (15,9): | -0.1400 | |
| Courbe Coppock: | 0.45 |
| MA7: | 75.87 | |
| MA20: | 88.66 | |
| MA50: | 86.64 | |
| MA100: | 84.15 | |
| MAexp7: | 75.74 | |
| MAexp20: | 74.96 | |
| MAexp50: | 77.27 | |
| MAexp100: | 82.06 | |
| Price / MA7: | -0.14% | |
| Price / MA20: | -14.55% | |
| Price / MA50: | -12.56% | |
| Price / MA100: | -9.97% | |
| Price / MAexp7: | +0.03% | |
| Price / MAexp20: | +1.07% | |
| Price / MAexp50: | -1.95% | |
| Price / MAexp100: | -7.68% |
News
Don't forget to follow the news on CENTRUS ENERGY. At the time of publication of this analysis, the latest news was as follows:
- Centrus Energy to Participate in Upcoming Investor Conferences
- Centrus Reports Fourth Quarter and Full Year 2024 Results
- Centrus to Webcast Conference Call on February 7 at 8:30 a.m. ET
- Centrus Energy to Participate in Goldman Sachs Energy, CleanTech & Utilities Conference
- Centrus Wins LEU Enrichment Award from U.S. Department of Energy
About author
Online


Add a comment
Comments
0 comments on the analysis CENTRUS ENERGY - 1H