| Open: | 556.0 |
| Change: | -3.6 |
| Volume: | 2,113,951 |
| Low: | 553.6 |
| High: | 560.4 |
| High / Low range: | 6.8 |
| Type: | Stocks |
| Ticker: | KHC |
| ISIN: |
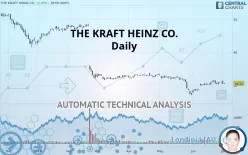
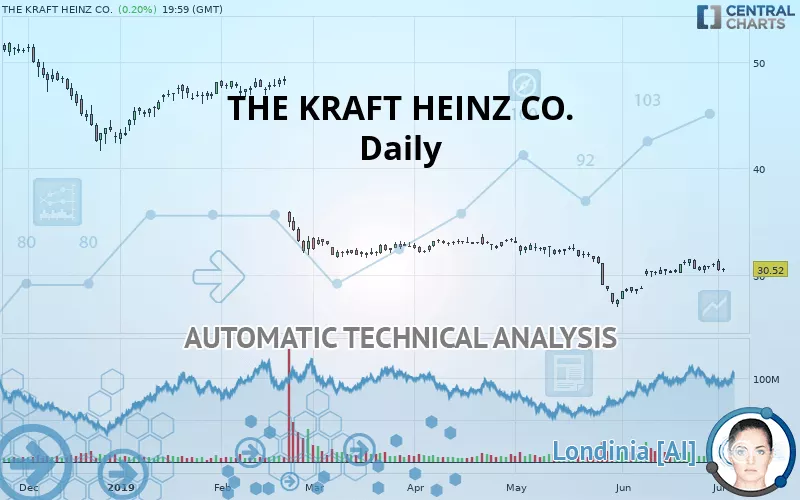
THE KRAFT HEINZ CO. - Daily - Technical analysis published on 07/03/2019 (GMT)
- 318
- 0
- 07/03/2019 - 11:48
Click here for a new analysis!
- Timeframe : Daily
- - Analysis generated on 07/03/2019 - 11:47
- Status : TARGET REACHED
Summary of the analysis

Additional analysis
Quotes
The THE KRAFT HEINZ CO. price is 30.52 USD. The price registered an increase of +0.20% on the session with the lowest point at 30.23 USD and the highest point at 30.64 USD. The deviation from the price is +0.96% for the low point and -0.39% for the high point.A bearish opening was detected by the Central Gaps scanner. Sellers are trying to impose a bearish trend in the very short term.
Bearish opening
Type : Bearish
Timeframe : Openning
Here is a more detailed summary of the historical variations registered by THE KRAFT HEINZ CO.:
Near a new HIGH record (1 month)
Type : Bullish
Timeframe : Weekly
Technical
Technical analysis of this Daily chart of THE KRAFT HEINZ CO. indicates that the overall trend is strongly bearish. 82.14% of the signals given by moving averages are bearish. Caution: as the signals currently given by short-term moving averages are rather neutral, the global trend is slowing down. The Central Indicators market scanner is currently detecting several bearish signals that could impact this trend:
Bearish trend reversal : adaptative moving average 20
Type : Bearish
Timeframe : Daily
Bearish price crossover with adaptative moving average 50
Type : Bearish
Timeframe : Daily
Bearish price crossover with adaptative moving average 100
Type : Bearish
Timeframe : Daily
The technical indicators are generally neutral. They do not provide relevant information on the direction of future price movements.
Central Indicators, the detector scanner for these technical indicators has recently detected several signals:
RSI indicator is back under 50
Type : Bearish
Timeframe : Daily
Parabolic SAR indicator bearish reversal
Type : Bearish
Timeframe : Daily
Price is back under the pivot point
Type : Bearish
Timeframe : Daily
Williams %R indicator is back under -50
Type : Bearish
Timeframe : Daily
An analysis of the price chart with the Central Patterns scanner (detector of chart patterns and resistances and supports) shows a result that can have an impact on the price change:
Near horizontal support
Type : Bullish
Timeframe : Daily
The presence of a bearish pattern in Japanese candlesticks detected by Central Candlesticks that could cause a correction in the very short term was also detected:
Bearish engulfing lines
Type : Bearish
Timeframe : Daily
| S2 | S1 | Price | R1 | R2 | R3 | |
|---|---|---|---|---|---|---|
| ProTrendLines | 27.40 | 30.48 | 30.52 | 33.27 | 42.54 | 48.23 |
| Change (%) | -10.22% | -0.13% | - | +9.01% | +39.38% | +58.03% |
| Change | -3.12 | -0.04 | - | +2.75 | +12.02 | +17.71 |
| Level | Major | Major | - | Intermediate | Minor | Major |
Attention could also be paid to pivot points to set price objectives:
| Pivot points | S3 | S2 | S1 | PP | R1 | R2 | R3 |
|---|---|---|---|---|---|---|---|
| Standard | 28.94 | 29.63 | 30.05 | 30.74 | 31.16 | 31.85 | 32.27 |
| Camarilla | 30.15 | 30.26 | 30.36 | 30.46 | 30.56 | 30.66 | 30.77 |
| Woodie | 28.80 | 29.56 | 29.91 | 30.67 | 31.01 | 31.78 | 32.12 |
| Fibonacci | 29.63 | 30.06 | 30.32 | 30.74 | 31.17 | 31.43 | 31.85 |
| Pivot points | S3 | S2 | S1 | PP | R1 | R2 | R3 |
|---|---|---|---|---|---|---|---|
| Standard | 28.99 | 29.57 | 30.31 | 30.89 | 31.63 | 32.21 | 32.95 |
| Camarilla | 30.68 | 30.80 | 30.92 | 31.04 | 31.16 | 31.28 | 31.40 |
| Woodie | 29.06 | 29.61 | 30.38 | 30.93 | 31.70 | 32.25 | 33.02 |
| Fibonacci | 29.57 | 30.08 | 30.39 | 30.89 | 31.40 | 31.71 | 32.21 |
Numerical data
The following is the status of the technical indicators and moving averages at the time of publication of this technical analysis:
| RSI (14): | 49.01 | |
| MACD (12,26,9): | 0.0100 | |
| Directional Movement: | 5.42 | |
| AROON (14): | 50.00 | |
| DEMA (21): | 30.47 | |
| Parabolic SAR (0,02-0,02-0,2): | 31.48 | |
| Elder Ray (13): | -0.16 | |
| Super Trend (3,10): | 29.23 | |
| Zig ZAG (10): | 30.52 | |
| VORTEX (21): | 1.1100 | |
| Stochastique (14,3,5): | 46.83 | |
| TEMA (21): | 30.91 | |
| Williams %R (14): | -64.47 | |
| Chande Momentum Oscillator (20): | 0.21 | |
| Repulse (5,40,3): | -0.8100 | |
| ROCnROLL: | 2 | |
| TRIX (15,9): | -0.0400 | |
| Courbe Coppock: | 7.58 |
| MA7: | 30.69 | |
| MA20: | 30.30 | |
| MA50: | 31.09 | |
| MA100: | 33.25 | |
| MAexp7: | 30.67 | |
| MAexp20: | 30.54 | |
| MAexp50: | 31.34 | |
| MAexp100: | 34.34 | |
| Price / MA7: | -0.55% | |
| Price / MA20: | +0.73% | |
| Price / MA50: | -1.83% | |
| Price / MA100: | -8.21% | |
| Price / MAexp7: | -0.49% | |
| Price / MAexp20: | -0.07% | |
| Price / MAexp50: | -2.62% | |
| Price / MAexp100: | -11.12% |
News
The last news published on THE KRAFT HEINZ CO. at the time of the generation of this analysis was as follows:
- 06/12/2019 - 15:31 Scott+Scott Attorneys at Law LLP Investigating Kraft Heinz's Directors and Officers for Breach of Fiduciary Duties - KHC
- 06/06/2019 - 13:00 Calling All “Rad Dads” of America: BAGEL BITES and Tony Hawk Want You to Join the #RadDadSquad
- 05/24/2019 - 13:00 Oscar Mayer and Ryan Newman Bring All-American Paint Scheme to Charlotte
- 05/20/2019 - 13:00 Maxwell House Becomes Official Coffee Partner of the United Service Organizations (USO) to Support the Hard Work of Service Members and Their Families
- 05/20/2019 - 13:00 Oscar Mayer, Rise Against Hunger and Roush Fenway Racing Team up to Fight Hunger
About author

Online


Add a comment
Comments
0 comments on the analysis THE KRAFT HEINZ CO. - Daily