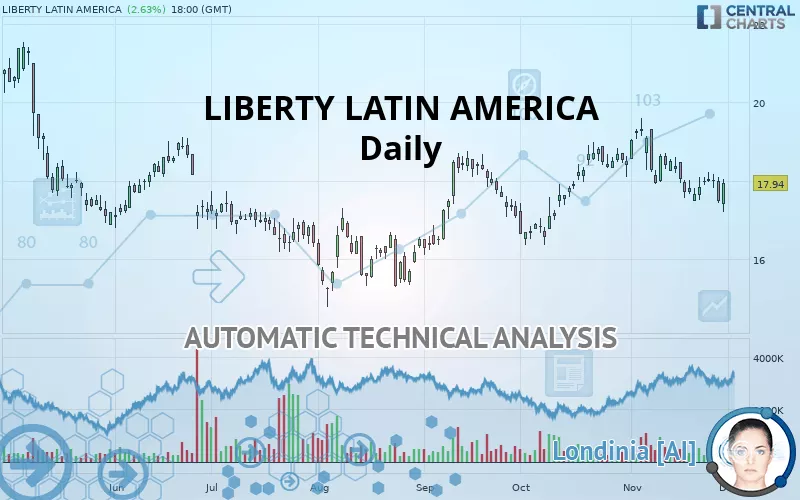
LIBERTY LATIN AMERICA - Daily - Technical analysis published on 12/02/2019 (GMT)
- 165
- 0
- Who voted?
- Timeframe : Daily
- - Analysis generated on
- Status : NEUTRAL

Summary of the analysis

Additional analysis
Quotes
The LIBERTY LATIN AMERICA rating is 17.94 USD. On the day, this instrument gained +2.63% and was between 17.19 USD and 18.05 USD. This implies that the price is at +4.36% from its lowest and at -0.61% from its highest.A bearish gap was detected at the opening by the Central Gaps scanner. There are a lot of sellers and they have the upper hand in the very short term.
Opening Gap DOWN
Type : Bearish
Timeframe : Openning
Here is a more detailed summary of the historical variations registered by LIBERTY LATIN AMERICA:
Technical
Technical analysis of this Daily chart of LIBERTY LATIN AMERICA indicates that the overall trend is slightly bullish. 57.14% of the signals given by moving averages are bullish. Caution: the slightly bearish signals currently given by short-term moving averages indicate that the overall trend could be reversed. An assessment of moving averages reveals several bearish signals that could impact this trend:
Bearish price crossover with Moving Average 50
Type : Bearish
Timeframe : Daily
Bearish price crossover with adaptative moving average 50
Type : Bearish
Timeframe : Daily
Bearish price crossover with adaptative moving average 100
Type : Bearish
Timeframe : Daily
An assessment of technical indicators does not currently provide any relevant information to suggest whether the signal given by the technical indicators is more bullish or bearish.
But beware of excesses. The Central Indicators scanner currently detects this:
CCI indicator is oversold : under -100
Type : Neutral
Timeframe : Daily
Williams %R indicator is oversold : under -80
Type : Neutral
Timeframe : Daily
Williams %R indicator is overbought : over -20
Type : Neutral
Timeframe : Daily
Pivot points : price is over resistance 1
Type : Neutral
Timeframe : Daily
Price is back under the pivot point
Type : Bearish
Timeframe : Daily
Momentum indicator is back under 0
Type : Bearish
Timeframe : Daily
Central Patterns, the market scanner focusing on chart patterns, resistances and supports found this result:
Horizontal resistance is broken
Type : Bullish
Timeframe : Daily
The Central Candlesticks scanner which studies Japanese candlesticks did not detect anything.
| S3 | S2 | S1 | Price | R1 | R2 | R3 | |
|---|---|---|---|---|---|---|---|
| ProTrendLines | 16.58 | 17.06 | 17.70 | 17.94 | 18.58 | 19.26 | 20.49 |
| Change (%) | -7.58% | -4.91% | -1.34% | - | +3.57% | +7.36% | +14.21% |
| Change | -1.36 | -0.88 | -0.24 | - | +0.64 | +1.32 | +2.55 |
| Level | Intermediate | Intermediate | Minor | - | Intermediate | Intermediate | Minor |
To determine price objectives, it is also possible to use the pivot points. Here is the price position in relation to pivot points:
| Pivot points | S3 | S2 | S1 | PP | R1 | R2 | R3 |
|---|---|---|---|---|---|---|---|
| Standard | 16.60 | 17.02 | 17.25 | 17.66 | 17.89 | 18.31 | 18.54 |
| Camarilla | 17.30 | 17.36 | 17.42 | 17.48 | 17.54 | 17.60 | 17.66 |
| Woodie | 16.51 | 16.97 | 17.16 | 17.62 | 17.80 | 18.26 | 18.45 |
| Fibonacci | 17.02 | 17.26 | 17.42 | 17.66 | 17.91 | 18.06 | 18.31 |
| Pivot points | S3 | S2 | S1 | PP | R1 | R2 | R3 |
|---|---|---|---|---|---|---|---|
| Standard | 16.98 | 17.22 | 17.60 | 17.85 | 18.23 | 18.47 | 18.85 |
| Camarilla | 17.81 | 17.87 | 17.92 | 17.98 | 18.04 | 18.10 | 18.15 |
| Woodie | 17.04 | 17.25 | 17.67 | 17.88 | 18.29 | 18.50 | 18.92 |
| Fibonacci | 17.22 | 17.46 | 17.61 | 17.85 | 18.08 | 18.23 | 18.47 |
| Pivot points | S3 | S2 | S1 | PP | R1 | R2 | R3 |
|---|---|---|---|---|---|---|---|
| Standard | 14.19 | 15.26 | 16.84 | 17.91 | 19.49 | 20.56 | 22.14 |
| Camarilla | 17.68 | 17.92 | 18.17 | 18.41 | 18.65 | 18.90 | 19.14 |
| Woodie | 14.44 | 15.39 | 17.09 | 18.04 | 19.74 | 20.69 | 22.39 |
| Fibonacci | 15.26 | 16.28 | 16.90 | 17.91 | 18.93 | 19.55 | 20.56 |
Numerical data
The following are the details of the technical indicators and moving averages that were collected to generate this technical analysis:
| RSI (14): | 48.06 | |
| MACD (12,26,9): | -0.1000 | |
| Directional Movement: | -9.48 | |
| AROON (14): | -85.71 | |
| DEMA (21): | 17.98 | |
| Parabolic SAR (0,02-0,02-0,2): | 18.17 | |
| Elder Ray (13): | -0.36 | |
| Super Trend (3,10): | 19.04 | |
| Zig ZAG (10): | 17.94 | |
| VORTEX (21): | 0.8500 | |
| Stochastique (14,3,5): | 27.84 | |
| TEMA (21): | 17.74 | |
| Williams %R (14): | -50.33 | |
| Chande Momentum Oscillator (20): | -0.46 | |
| Repulse (5,40,3): | 1.6700 | |
| ROCnROLL: | -1 | |
| TRIX (15,9): | -0.0200 | |
| Courbe Coppock: | 8.33 |
| MA7: | 17.85 | |
| MA20: | 18.25 | |
| MA50: | 17.95 | |
| MA100: | 17.30 | |
| MAexp7: | 17.88 | |
| MAexp20: | 18.05 | |
| MAexp50: | 17.94 | |
| MAexp100: | 17.78 | |
| Price / MA7: | +0.50% | |
| Price / MA20: | -1.70% | |
| Price / MA50: | -0.06% | |
| Price / MA100: | +3.70% | |
| Price / MAexp7: | +0.34% | |
| Price / MAexp20: | -0.61% | |
| Price / MAexp50: | -0% | |
| Price / MAexp100: | +0.90% |
News
Don"t forget to follow the news on LIBERTY LATIN AMERICA. At the time of publication of this analysis, the latest news was as follows:
About author

Online


Add a comment
Comments
0 comments on the analysis LIBERTY LATIN AMERICA - Daily