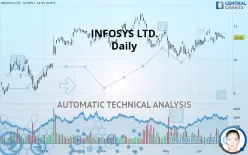
INFOSYS LTD. - Daily - Technical analysis published on 06/26/2019 (GMT)
- 376
- 0
- Who voted?
Click here for a new analysis!
- Timeframe : Daily
- - Analysis generated on
- Status : INVALID

Summary of the analysis

Additional analysis
Quotes
The INFOSYS LTD. rating is 10.65 USD. The price registered an increase of +0.00% on the session with the lowest point at 10.62 USD and the highest point at 10.68 USD. The deviation from the price is +0.28% for the low point and -0.28% for the high point.A bullish opening was detected by the Central Gaps scanner. Buyers are trying to impose a bullish momentum in the very short term.
Bullish opening
Type : Bullish
Timeframe : Openning
A study of price movements over other periods shows the following variations:
Near a new HIGH record (5 years)
Type : Bullish
Timeframe : Weekly
Technical
A technical analysis in Daily of this INFOSYS LTD. chart shows a bullish trend. The signals returned by the moving averages are 78.57% bullish. This bullish trend is reinforced by the strong signals currently being given by short-term moving averages. The Central Indicators market scanner is currently detecting several bearish and bullish signals that could impact this trend:
Bullish trend reversal : Moving Average 50
Type : Bullish
Timeframe : Daily
Bearish trend reversal : Moving Average 100
Type : Bearish
Timeframe : Daily
Technical indicators are slightly bullish. There is therefore considerable uncertainty about the continuation of the increase.
Caution: the Central Indicators scanner currently detects an excess:
Williams %R indicator is overbought : over -20
Type : Neutral
Timeframe : Daily
Parabolic SAR indicator bearish reversal
Type : Bearish
Timeframe : Daily
Price is back over the pivot point
Type : Bullish
Timeframe : Weekly
Price is back under the pivot point
Type : Bearish
Timeframe : Daily
The Central Patterns scanner, which studies chart patterns, resistances and supports, has identified this signal:
Near resistance of channel
Type : Bearish
Timeframe : Daily
The Central Candlesticks scanner, specialised in Japanese candlesticks, did not identify any signals.
| S3 | S2 | S1 | Price | R1 | R2 | R3 | |
|---|---|---|---|---|---|---|---|
| ProTrendLines | 9.70 | 9.90 | 10.60 | 10.65 | 10.84 | 11.06 | 11.32 |
| Change (%) | -8.92% | -7.04% | -0.47% | - | +1.78% | +3.85% | +6.29% |
| Change | -0.95 | -0.75 | -0.05 | - | +0.19 | +0.41 | +0.67 |
| Level | Major | Intermediate | Major | - | Major | Minor | Major |
To determine price objectives, it is also possible to use the pivot points. Here is the price position in relation to pivot points:
| Pivot points | S3 | S2 | S1 | PP | R1 | R2 | R3 |
|---|---|---|---|---|---|---|---|
| Standard | 10.52 | 10.56 | 10.61 | 10.65 | 10.70 | 10.74 | 10.79 |
| Camarilla | 10.63 | 10.63 | 10.64 | 10.65 | 10.66 | 10.67 | 10.67 |
| Woodie | 10.52 | 10.56 | 10.60 | 10.65 | 10.69 | 10.74 | 10.78 |
| Fibonacci | 10.56 | 10.60 | 10.62 | 10.65 | 10.69 | 10.71 | 10.74 |
| Pivot points | S3 | S2 | S1 | PP | R1 | R2 | R3 |
|---|---|---|---|---|---|---|---|
| Standard | 10.16 | 10.31 | 10.52 | 10.67 | 10.88 | 11.03 | 11.24 |
| Camarilla | 10.62 | 10.65 | 10.69 | 10.72 | 10.75 | 10.79 | 10.82 |
| Woodie | 10.18 | 10.32 | 10.54 | 10.69 | 10.90 | 11.05 | 11.26 |
| Fibonacci | 10.31 | 10.45 | 10.54 | 10.67 | 10.81 | 10.90 | 11.03 |
Numerical data
The following are the details of the technical indicators and moving averages that were collected to generate this technical analysis:
| RSI (14): | 55.99 | |
| MACD (12,26,9): | 0.1000 | |
| Directional Movement: | 1.34 | |
| AROON (14): | 57.14 | |
| DEMA (21): | 10.69 | |
| Parabolic SAR (0,02-0,02-0,2): | 10.83 | |
| Elder Ray (13): | 0.03 | |
| Super Trend (3,10): | 10.27 | |
| Zig ZAG (10): | 10.65 | |
| VORTEX (21): | 0.9900 | |
| Stochastique (14,3,5): | 65.72 | |
| TEMA (21): | 10.76 | |
| Williams %R (14): | -39.20 | |
| Chande Momentum Oscillator (20): | 0.01 | |
| Repulse (5,40,3): | -0.9000 | |
| ROCnROLL: | 1 | |
| TRIX (15,9): | 0.1300 | |
| Courbe Coppock: | 5.21 |
| MA7: | 10.69 | |
| MA20: | 10.57 | |
| MA50: | 10.38 | |
| MA100: | 10.53 | |
| MAexp7: | 10.66 | |
| MAexp20: | 10.57 | |
| MAexp50: | 10.48 | |
| MAexp100: | 10.38 | |
| Price / MA7: | -0.37% | |
| Price / MA20: | +0.76% | |
| Price / MA50: | +2.60% | |
| Price / MA100: | +1.14% | |
| Price / MAexp7: | -0.09% | |
| Price / MAexp20: | +0.76% | |
| Price / MAexp50: | +1.62% | |
| Price / MAexp100: | +2.60% |
About author

Online


Add a comment
Comments
0 comments on the analysis INFOSYS LTD. - Daily