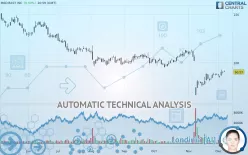
MEDIFAST INC - Daily - Technical analysis published on 12/09/2019 (GMT)
- 275
- 0
- Who voted?
Click here for a new analysis!
- Timeframe : Daily
- - Analysis generated on
- Status : TARGET REACHED

Summary of the analysis

Additional analysis
Quotes
MEDIFAST INC rating 90.57 USD. On the day, this instrument gained +0.50% with the lowest point at 90.40 USD and the highest point at 92.11 USD. The deviation from the price is +0.19% for the low point and -1.67% for the high point.A bullish opening was detected by the Central Gaps scanner. Buyers are trying to impose a bullish momentum in the very short term.
Bullish opening
Type : Bullish
Timeframe : Openning
So that you have an overall view of the price change, here is a table showing the variations over several periods:
Near a new HIGH record (1 month)
Type : Bullish
Timeframe : Weekly
The Central Volumes scanner detects abnormal volumes on the asset:
Abnormal volumes
Timeframe : 20 days
Technical
Technical analysis of this Daily chart of MEDIFAST INC indicates that the overall trend is bearish. 75% of the signals given by moving averages are bearish. Caution: as the signals currently given by short-term moving averages are rather neutral, the bearish trend could slow down. There is no crossing of moving average by the price or crossing of moving averages between themselves.
The probability of a further increase are moderate given the direction of the technical indicators.
Caution: the Central Indicators scanner currently detects an excess:
Williams %R indicator is overbought : over -20
Type : Neutral
Timeframe : Daily
Pivot points : price is over resistance 1
Type : Neutral
Timeframe : Weekly
RSI indicator is back under 50
Type : Bearish
Timeframe : Daily
Price is back over the pivot point
Type : Bullish
Timeframe : Daily
Central Patterns, the scanner specializing in chart patterns, did not identify any signals.
The Central Candlesticks scanner which studies Japanese candlesticks did not detect anything.
| S3 | S2 | S1 | Price | R1 | R2 | R3 | |
|---|---|---|---|---|---|---|---|
| ProTrendLines | 63.32 | 74.36 | 88.30 | 90.57 | 98.20 | 107.24 | 125.93 |
| Change (%) | -30.09% | -17.90% | -2.51% | - | +8.42% | +18.41% | +39.04% |
| Change | -27.25 | -16.21 | -2.27 | - | +7.63 | +16.67 | +35.36 |
| Level | Major | Major | Intermediate | - | Intermediate | Major | Minor |
To determine price objectives, it is also possible to use the pivot points. Here is the price position in relation to pivot points:
| Pivot points | S3 | S2 | S1 | PP | R1 | R2 | R3 |
|---|---|---|---|---|---|---|---|
| Standard | 86.49 | 87.67 | 88.90 | 90.08 | 91.31 | 92.49 | 93.72 |
| Camarilla | 89.46 | 89.68 | 89.90 | 90.12 | 90.34 | 90.56 | 90.78 |
| Woodie | 86.51 | 87.68 | 88.92 | 90.09 | 91.33 | 92.50 | 93.74 |
| Fibonacci | 87.67 | 88.59 | 89.16 | 90.08 | 91.00 | 91.57 | 92.49 |
| Pivot points | S3 | S2 | S1 | PP | R1 | R2 | R3 |
|---|---|---|---|---|---|---|---|
| Standard | 79.23 | 81.59 | 84.79 | 87.15 | 90.35 | 92.71 | 95.91 |
| Camarilla | 86.45 | 86.96 | 87.47 | 87.98 | 88.49 | 89.00 | 89.51 |
| Woodie | 79.64 | 81.80 | 85.20 | 87.36 | 90.76 | 92.92 | 96.32 |
| Fibonacci | 81.59 | 83.72 | 85.03 | 87.15 | 89.28 | 90.59 | 92.71 |
| Pivot points | S3 | S2 | S1 | PP | R1 | R2 | R3 |
|---|---|---|---|---|---|---|---|
| Standard | 17.99 | 42.25 | 65.11 | 89.37 | 112.23 | 136.49 | 159.35 |
| Camarilla | 75.02 | 79.34 | 83.66 | 87.98 | 92.30 | 96.62 | 100.94 |
| Woodie | 17.30 | 41.90 | 64.42 | 89.02 | 111.54 | 136.14 | 158.66 |
| Fibonacci | 42.25 | 60.25 | 71.37 | 89.37 | 107.37 | 118.49 | 136.49 |
Numerical data
The following is the status of the technical indicators and moving averages at the time of publication of this technical analysis:
| RSI (14): | 50.27 | |
| MACD (12,26,9): | -2.0200 | |
| Directional Movement: | 2.38 | |
| AROON (14): | 85.71 | |
| DEMA (21): | 85.67 | |
| Parabolic SAR (0,02-0,02-0,2): | 70.61 | |
| Elder Ray (13): | 3.04 | |
| Super Trend (3,10): | 91.63 | |
| Zig ZAG (10): | 90.57 | |
| VORTEX (21): | 1.0700 | |
| Stochastique (14,3,5): | 84.62 | |
| TEMA (21): | 86.69 | |
| Williams %R (14): | -15.21 | |
| Chande Momentum Oscillator (20): | 1.91 | |
| Repulse (5,40,3): | 0.6200 | |
| ROCnROLL: | -1 | |
| TRIX (15,9): | -0.5700 | |
| Courbe Coppock: | 17.16 |
| MA7: | 88.64 | |
| MA20: | 84.15 | |
| MA50: | 96.08 | |
| MA100: | 100.39 | |
| MAexp7: | 88.75 | |
| MAexp20: | 89.10 | |
| MAexp50: | 94.35 | |
| MAexp100: | 101.41 | |
| Price / MA7: | +2.18% | |
| Price / MA20: | +7.63% | |
| Price / MA50: | -5.73% | |
| Price / MA100: | -9.78% | |
| Price / MAexp7: | +2.05% | |
| Price / MAexp20: | +1.65% | |
| Price / MAexp50: | -4.01% | |
| Price / MAexp100: | -10.69% |
News
Don"t forget to follow the news on MEDIFAST INC. At the time of publication of this analysis, the latest news was as follows:
- Medifast, Inc. Announces 51 Percent Increase in Quarterly Dividend
- Medifast Adopts Limited Duration Stockholder Rights Plan
- Medifast, Inc. Announces Third Quarter 2019 Results
- Medifast, Inc. to Announce Financial Results for the Third Quarter Ended September 30, 2019
- Medifast® Names New Human Resources Executive Amid Historic Growth
About author

Online


Add a comment
Comments
0 comments on the analysis MEDIFAST INC - Daily