ING GROUP N.V. overview
ING GROUP N.V.
> Analyses

 Thank you
Reply
Chart
Thank you
Reply
Chart
Londinia
has published a new analysis.
- 0
- 93802
- 15800
- 0
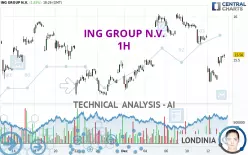
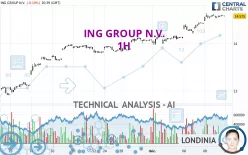
Timeframe : 1H - Simple chart
Status : NEUTRAL
A slightly bearish trend and a neutral short term. With such a pattern, it is difficult to favour buying or selling. The first support is located at 15.29 USD. The first resistance is located at…
ING GROUP N.V.
> Analyses
 Thank you
Reply
Chart
Thank you
Reply
Chart
Londinia
has published a new analysis.
- 0
- 93802
- 15800
- 0
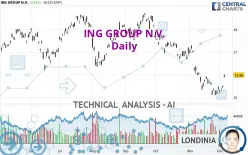
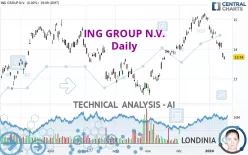
Timeframe : Daily - Simple chart
Status : TARGET REACHED
Has the basic bearish trend slowed or is it lacking in power? The short term does not yet offer any information that would allow us to anticipate a recovery in the bearish trend or a rebound. Sellers'…
ING GROUP N.V.
> Analyses
 Thank you
Reply
Chart
Thank you
Reply
Chart
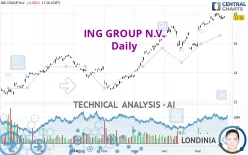
Timeframe : Daily - Simple chart
Status : TARGET REACHED
All elements being clearly bullish, it would be possible for traders to trade only long positions (at the time of purchase) on ING GROUP N.V. as long as the price remains well above 16.04 USD. The…
ING GROUP N.V.
> Analyses
 Thank you
Reply
Chart
Thank you
Reply
Chart
Londinia
has published a new analysis.
- 0
- 93802
- 15800
- 0
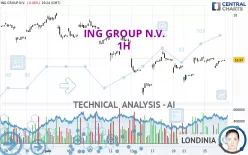
Timeframe : 1H - Simple chart
Status : NEUTRAL
The short-term increase on ING GROUP N.V. remains moderate but could challenge the slightly bearish basic trend. It is difficult to advise a trading direction under these conditions. The first…
ING GROUP N.V.
> Analyses
 Thank you
Reply
Chart
Thank you
Reply
Chart
Londinia
has published a new analysis.
- 0
- 93802
- 15800
- 0
Timeframe : Daily - Simple chart
Status : INVALID
All elements being clearly bullish, it would be possible for traders to trade only long positions (at the time of purchase) on ING GROUP N.V. as long as the price remains well above 17.28 USD. The…
ING GROUP N.V.
> Analyses
 Thank you
Reply
Chart
Thank you
Reply
Chart
Londinia
has published a new analysis.
- 0
- 93802
- 15800
- 0
Timeframe : Daily - Simple chart
Status : INVALID
In the short term, we can see an acceleration in the bearish trend on ING GROUP N.V., which is a positive signal for sellers. As long as the price remains above 13.97 USD, a sale could be considered.…
ING GROUP N.V.
> Analyses
 Thank you
Reply
Chart
Thank you
Reply
Chart
Londinia
has published a new analysis.
- 0
- 93802
- 15800
- 0
Timeframe : 1H - Simple chart
Status : LEVEL MAINTAINED
ING GROUP N.V. is part of a very strong bullish trend. Traders may consider trading only long positions (at the time of purchase) as long as the price remains well above 14.280 USD. The next…

