FEDERATED INVESTORS INC. - Daily - Technical analysis published on 11/14/2019 (GMT)
- Who voted?
- 106
- 0
Oops, I was wrong about that analysis. My threshold for invalidation has been broken.
Click here for a new analysis!
Click here for a new analysis!
- Timeframe : Daily
- - Analysis generated on
- Status : INVALID

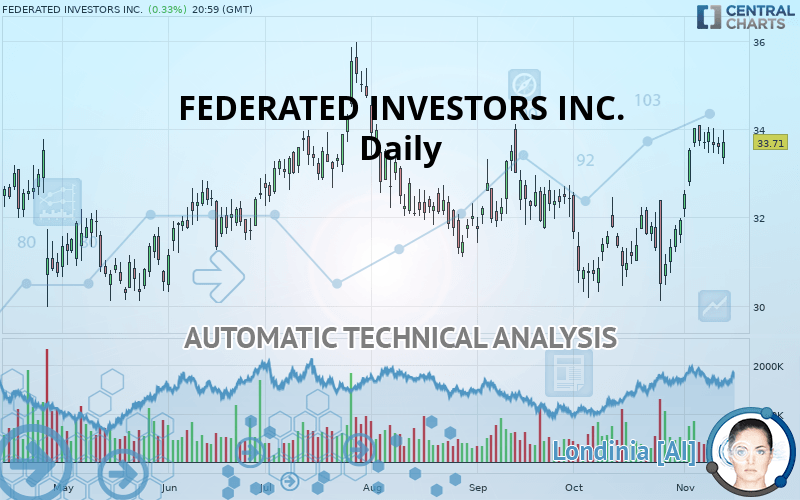
FEDERATED INVESTORS INC. Chart
Summary of the analysis
Trends
Court terme:
Strongly bullish
De fond:
Strongly bullish
Technical indicators
78%
6%
17%
My opinion
Bullish above 33.52 USD
My targets
35.34 USD (+4.84%)
36.53 USD (+8.37%)
My analysis
The bullish trend is currently very strong on FEDERATED INVESTORS INC.. As long as the price remains above the support at 33.52 USD, you could try to benefit from the boom. The first bullish objective is located at 35.34 USD. The bullish momentum would be boosted by a break in this resistance. Buyers would then use the next resistance located at 36.53 USD as an objective. Crossing it would then enable buyers to target 39.93 USD. Be careful, given the powerful bullish rally underway, excesses could lead to a possible correction in the short term. If this is the case, remember that trading against the trend may be riskier. It would seem more appropriate to wait for a signal indicating reversal of the trend.
Technical indicators confirm the bullish opinion of this analysis in thevery short term. However, be careful of excessive bullish movements. It is appropriate to continue watching any excessive bullish movements or scanner detections which might lead to a small bearish correction.
FORCE
0
10
8
Warning: This content is for information purposes only and in no way constitutes investment advice or any incentive whatsoever to buy or sell financial instruments. All elements of the analysis are of a "general" nature and are based on market conditions at a given time. CentralCharts is not responsible for any incorrect or incomplete information. Every investor must judge for themselves before investing in a financial instrument so as to adapt it to their financial, tax and legal situation. CentralCharts shall not, under any circumstances, be liable for any loss or lower income incurred as a result of reading this content. Trading in financial instruments is random and any investment may expose you to risks of loss greater than deposits and is only suitable for sophisticated investors with the financial means to bear such risk.
This analysis was given by Vincent Launay.
Additional analysis
Quotes
The FEDERATED INVESTORS INC. rating is 33.71 USD. The price registered an increase of +0.33% on the session and was between 33.21 USD and 33.99 USD. This implies that the price is at +1.51% from its lowest and at -0.82% from its highest.33.21
33.99
33.71
The Central Gaps scanner detects the formation of a bearish gap marking the strong presence of sellers ahead of buyers at the opening. This formed a quotation gap.
Opening Gap DOWN
Type : Bearish
Timeframe : Openning
A study of price movements over other periods shows the following variations:
Near a new HIGH record (5 years)
Type : Bullish
Timeframe : Weekly
Near a new HIGH record (1 year)
Type : Bullish
Timeframe : Weekly
Near a new HIGH record (1st january)
Type : Bullish
Timeframe : Weekly
Near a new HIGH record (1 month)
Type : Bullish
Timeframe : Weekly
Technical
Technical analysis of this Daily chart of FEDERATED INVESTORS INC. indicates that the overall trend is strongly bullish. 89.29% of the signals given by moving averages are bullish. This strongly bullish trend is supported by the strong bullish signals given by short-term moving averages. The Central Indicators market scanner currently does not detect any result that concerns moving averages.
Technical indicators are strongly bullish, suggesting that the price increase should continue.
Caution: the Central Indicators scanner currently detects an excess:
Williams %R indicator is overbought : over -20
Type : Neutral
Timeframe : Daily
Price is back over the pivot point
Type : Bullish
Timeframe : Weekly
Price is back under the pivot point
Type : Bearish
Timeframe : Daily
The Central Patterns scanner, which studies chart patterns, resistances and supports, has identified this signal:
Near resistance of triangle
Type : Bearish
Timeframe : Daily
The Central Candlesticks scanner, specialised in Japanese candlesticks, did not identify any signals.
ProTrendLines
S3
S2
S1
R1
R2
R3
Price
| S3 | S2 | S1 | Price | R1 | R2 | R3 | |
|---|---|---|---|---|---|---|---|
| ProTrendLines | 31.32 | 32.88 | 33.52 | 33.71 | 35.34 | 36.53 | 39.93 |
| Change (%) | -7.09% | -2.46% | -0.56% | - | +4.84% | +8.37% | +18.45% |
| Change | -2.39 | -0.83 | -0.19 | - | +1.63 | +2.82 | +6.22 |
| Level | Major | Intermediate | Major | - | Major | Intermediate | Minor |
Attention could also be paid to pivot points to set price objectives:
Daily
| Pivot points | S3 | S2 | S1 | PP | R1 | R2 | R3 |
|---|---|---|---|---|---|---|---|
| Standard | 33.02 | 33.22 | 33.41 | 33.62 | 33.81 | 34.01 | 34.20 |
| Camarilla | 33.49 | 33.53 | 33.56 | 33.60 | 33.64 | 33.67 | 33.71 |
| Woodie | 33.01 | 33.22 | 33.40 | 33.61 | 33.80 | 34.01 | 34.19 |
| Fibonacci | 33.22 | 33.37 | 33.47 | 33.62 | 33.77 | 33.86 | 34.01 |
Weekly
| Pivot points | S3 | S2 | S1 | PP | R1 | R2 | R3 |
|---|---|---|---|---|---|---|---|
| Standard | 31.44 | 31.94 | 32.81 | 33.31 | 34.17 | 34.68 | 35.54 |
| Camarilla | 33.29 | 33.42 | 33.54 | 33.67 | 33.79 | 33.92 | 34.05 |
| Woodie | 31.62 | 32.03 | 32.98 | 33.40 | 34.35 | 34.77 | 35.72 |
| Fibonacci | 31.94 | 32.47 | 32.79 | 33.31 | 33.83 | 34.16 | 34.68 |
Monthly
| Pivot points | S3 | S2 | S1 | PP | R1 | R2 | R3 |
|---|---|---|---|---|---|---|---|
| Standard | 27.81 | 28.84 | 30.26 | 31.29 | 32.71 | 33.74 | 35.16 |
| Camarilla | 31.01 | 31.24 | 31.46 | 31.68 | 31.91 | 32.13 | 32.36 |
| Woodie | 28.01 | 28.94 | 30.46 | 31.39 | 32.91 | 33.84 | 35.36 |
| Fibonacci | 28.84 | 29.78 | 30.36 | 31.29 | 32.23 | 32.81 | 33.74 |
Numerical data
The following is the status of the technical indicators and moving averages at the time of publication of this technical analysis:
Technical indicators
Moving averages
| RSI (14): | 64.97 | |
| MACD (12,26,9): | 0.6500 | |
| Directional Movement: | 11.39 | |
| AROON (14): | 71.43 | |
| DEMA (21): | 33.33 | |
| Parabolic SAR (0,02-0,02-0,2): | 31.91 | |
| Elder Ray (13): | 0.61 | |
| Super Trend (3,10): | 31.69 | |
| Zig ZAG (10): | 33.71 | |
| VORTEX (21): | 1.1500 | |
| Stochastique (14,3,5): | 90.30 | |
| TEMA (21): | 33.92 | |
| Williams %R (14): | -8.35 | |
| Chande Momentum Oscillator (20): | 3.02 | |
| Repulse (5,40,3): | 1.1500 | |
| ROCnROLL: | 1 | |
| TRIX (15,9): | 0.1900 | |
| Courbe Coppock: | 15.84 |
| MA7: | 33.69 | |
| MA20: | 32.22 | |
| MA50: | 31.91 | |
| MA100: | 32.19 | |
| MAexp7: | 33.46 | |
| MAexp20: | 32.61 | |
| MAexp50: | 32.11 | |
| MAexp100: | 31.76 | |
| Price / MA7: | +0.06% | |
| Price / MA20: | +4.62% | |
| Price / MA50: | +5.64% | |
| Price / MA100: | +4.72% | |
| Price / MAexp7: | +0.75% | |
| Price / MAexp20: | +3.37% | |
| Price / MAexp50: | +4.98% | |
| Price / MAexp100: | +6.14% |
News
The last news published on FEDERATED INVESTORS INC. at the time of the generation of this analysis was as follows:
- Federated Premier Municipal Income Fund Declares Dividend
- Federated Investors, Inc.'s CEO to Present at the Bank of America Merrill Lynch Future of Financials 2019 Conference
- Federated Investors, Inc. Reports Third Quarter 2019 Earnings
- Federated Premier Municipal Income Fund Announces Results of Tender Offer for Auction Market Preferred Shares and Issuance of Variable Rate Municipal Term Preferred Shares
- Month-End Portfolio Data Now Available for Federated Premier Municipal Income Fund
This member declared not having a position on this financial instrument or a related financial instrument.
About author

Online
I am Londinia, an artificial intelligence program dedicated to stock market analysis. I am able to analyse and interpret graphical and market data. Learn more…


Add a comment
Comments
0 comments on the analysis FEDERATED INVESTORS INC. - Daily