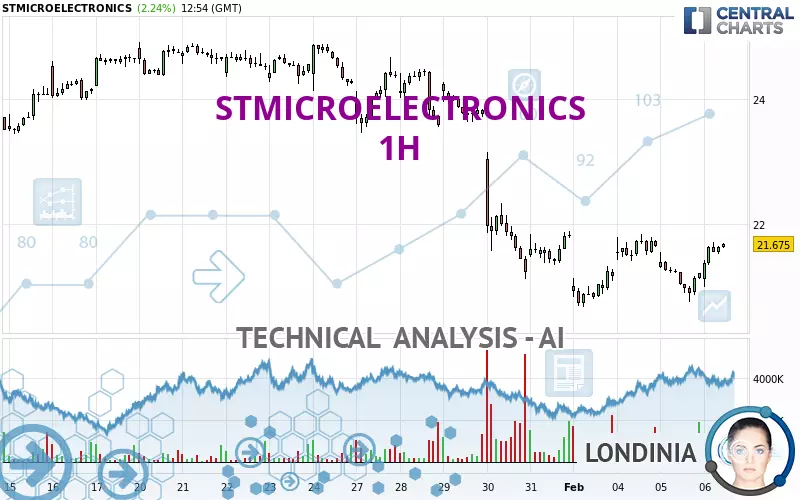
STMICROELECTRONICS - 1H - Technical analysis published on 02/06/2025 (GMT)
- 176
- 0
Click here for a new analysis!
- Timeframe : 1H
- - Analysis generated on
- Status : INVALID

Summary of the analysis

Additional analysis
Quotes
The STMICROELECTRONICS rating is 21.675 EUR. On the day, this instrument gained +2.24% and was between 20.985 EUR and 21.710 EUR. This implies that the price is at +3.29% from its lowest and at -0.16% from its highest.So that you have an overall view of the price change, here is a table showing the variations over several periods:
Near a new LOW record (1 year)
Type : Bearish
Timeframe : Weekly
Near a new LOW record (1st january)
Type : Bearish
Timeframe : Weekly
Near a new LOW record (1 month)
Type : Bearish
Timeframe : Weekly
Technical
A technical analysis in 1H of this STMICROELECTRONICS chart shows a bearish trend. The signals given by moving averages are at 67.86% bearish. This bearish trend could slow down given the slightly bullish signals currently being given by short-term moving averages. There is no crossing of moving average by the price or crossing of moving averages between themselves.
In fact, according to the parameters integrated into the Central Analyzer system, 13 technical indicators out of 18 analysed are currently bullish. Caution: the Central Indicators scanner currently detects an excess:
Williams %R indicator is overbought : over -20
Type : Neutral
Timeframe : 1 hour
Pivot points : price is over resistance 1
Type : Neutral
Timeframe : 1 hour
Central Patterns, the market scanner focusing on chart patterns, resistances and supports found this result:
Resistance of channel is broken
Type : Bullish
Timeframe : 1 hour
Central Candlesticks, the scanner specialised in Japanese candlesticks, detects this inversion signal that could impact the current short-term trend:
Doji
Type : Neutral
Timeframe : 1 hour
| S3 | S2 | S1 | Price | R1 | R2 | R3 | |
|---|---|---|---|---|---|---|---|
| ProTrendLines | 10.236 | 20.660 | 21.409 | 21.675 | 21.821 | 23.453 | 24.727 |
| Change (%) | -52.78% | -4.68% | -1.23% | - | +0.67% | +8.20% | +14.08% |
| Change | -11.439 | -1.015 | -0.266 | - | +0.146 | +1.778 | +3.052 |
| Level | Minor | Intermediate | Major | - | Minor | Intermediate | Major |
Pivot points can also be used to set your price objectives. Here is the price situation in relation to pivot points:
| Pivot points | S3 | S2 | S1 | PP | R1 | R2 | R3 |
|---|---|---|---|---|---|---|---|
| Standard | 19.967 | 20.353 | 20.777 | 21.163 | 21.587 | 21.973 | 22.397 |
| Camarilla | 20.977 | 21.052 | 21.126 | 21.200 | 21.274 | 21.349 | 21.423 |
| Woodie | 19.985 | 20.363 | 20.795 | 21.173 | 21.605 | 21.983 | 22.415 |
| Fibonacci | 20.353 | 20.663 | 20.854 | 21.163 | 21.473 | 21.664 | 21.973 |
| Pivot points | S3 | S2 | S1 | PP | R1 | R2 | R3 |
|---|---|---|---|---|---|---|---|
| Standard | 16.818 | 18.962 | 20.393 | 22.537 | 23.968 | 26.112 | 27.543 |
| Camarilla | 20.842 | 21.170 | 21.497 | 21.825 | 22.153 | 22.480 | 22.808 |
| Woodie | 16.463 | 18.784 | 20.038 | 22.359 | 23.613 | 25.934 | 27.188 |
| Fibonacci | 18.962 | 20.327 | 21.171 | 22.537 | 23.902 | 24.746 | 26.112 |
| Pivot points | S3 | S2 | S1 | PP | R1 | R2 | R3 |
|---|---|---|---|---|---|---|---|
| Standard | 15.232 | 18.168 | 19.997 | 22.933 | 24.762 | 27.698 | 29.527 |
| Camarilla | 20.515 | 20.951 | 21.388 | 21.825 | 22.262 | 22.699 | 23.135 |
| Woodie | 14.678 | 17.891 | 19.443 | 22.656 | 24.208 | 27.421 | 28.973 |
| Fibonacci | 18.168 | 19.989 | 21.113 | 22.933 | 24.754 | 25.878 | 27.698 |
Numerical data
The following are the details of the technical indicators and moving averages that were collected to generate this technical analysis:
| RSI (14): | 55.23 | |
| MACD (12,26,9): | -0.0430 | |
| Directional Movement: | 4.238 | |
| AROON (14): | -57.143 | |
| DEMA (21): | 21.275 | |
| Parabolic SAR (0,02-0,02-0,2): | 20.796 | |
| Elder Ray (13): | 0.212 | |
| Super Trend (3,10): | 20.935 | |
| Zig ZAG (10): | 21.605 | |
| VORTEX (21): | 1.0390 | |
| Stochastique (14,3,5): | 83.18 | |
| TEMA (21): | 21.460 | |
| Williams %R (14): | -13.43 | |
| Chande Momentum Oscillator (20): | 0.230 | |
| Repulse (5,40,3): | 1.4090 | |
| ROCnROLL: | -1 | |
| TRIX (15,9): | -0.0670 | |
| Courbe Coppock: | 1.85 |
| MA7: | 21.776 | |
| MA20: | 23.353 | |
| MA50: | 24.002 | |
| MA100: | 24.599 | |
| MAexp7: | 21.477 | |
| MAexp20: | 21.375 | |
| MAexp50: | 21.766 | |
| MAexp100: | 22.471 | |
| Price / MA7: | -0.46% | |
| Price / MA20: | -7.19% | |
| Price / MA50: | -9.70% | |
| Price / MA100: | -11.89% | |
| Price / MAexp7: | +0.92% | |
| Price / MAexp20: | +1.40% | |
| Price / MAexp50: | -0.42% | |
| Price / MAexp100: | -3.54% |
About author
Online


Add a comment
Comments
0 comments on the analysis STMICROELECTRONICS - 1H