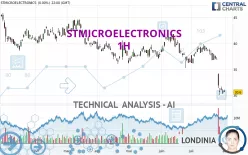
STMICROELECTRONICS - 1H - Technical analysis published on 08/01/2024 (GMT)
- 193
- 0
Click here for a new analysis!
- Timeframe : 1H
- - Analysis generated on
- Status : TARGET REACHED

Summary of the analysis

Additional analysis
Quotes
The STMICROELECTRONICS price is 31.040 EUR. The price registered an increase of +1.44% on the session and was between 30.990 EUR and 31.165 EUR. This implies that the price is at +0.16% from its lowest and at -0.40% from its highest.A bullish opening was detected by the Central Gaps scanner. Buyers are trying to impose a bullish momentum in the very short term.
Bullish opening
Type : Bullish
Timeframe : Openning
Here is a more detailed summary of the historical variations registered by STMICROELECTRONICS:
Near a new LOW record (1 year)
Type : Bearish
Timeframe : Weekly
Near a new LOW record (1st january)
Type : Bearish
Timeframe : Weekly
Near a new LOW record (1 month)
Type : Bearish
Timeframe : Weekly
Abnormal volumes on STMICROELECTRONICS were detected by the Central Volumes scanner:
Abnormal volumes
Timeframe : 5 days
Technical
Technical analysis of STMICROELECTRONICS in 1H shows an overall bearish trend. 78.57% of the signals given by moving averages are bearish. Caution: as the signals currently given by short-term moving averages are rather neutral, the bearish trend could slow down. The Central Indicators market scanner currently does not detect any result that concerns moving averages.
An assessment of technical indicators does not currently provide any relevant information on the direction of future price movements.
But beware of excesses. The Central Indicators scanner currently detects this:
CCI indicator is oversold : under -100
Type : Neutral
Timeframe : 1 hour
Price is back under the pivot point
Type : Bearish
Timeframe : 1 hour
Central Patterns, the market scanner focusing on chart patterns, resistances and supports found this result:
Near horizontal support
Type : Bullish
Timeframe : 1 hour
For a small setback in the very short term, the Central Candlesticks scanner currently notes the presence of this bearish pattern in Japanese candlesticks:
Three black crows
Type : Bearish
Timeframe : 1 hour
| S3 | S2 | S1 | Price | R1 | R2 | R3 | |
|---|---|---|---|---|---|---|---|
| ProTrendLines | 25.462 | 27.839 | 30.676 | 31.040 | 31.677 | 35.071 | 36.204 |
| Change (%) | -17.97% | -10.31% | -1.17% | - | +2.05% | +12.99% | +16.64% |
| Change | -5.578 | -3.201 | -0.364 | - | +0.637 | +4.031 | +5.164 |
| Level | Minor | Major | Intermediate | - | Minor | Major | Major |
Pivot points can also be used to set your price objectives. Here is the price situation in relation to pivot points:
| Pivot points | S3 | S2 | S1 | PP | R1 | R2 | R3 |
|---|---|---|---|---|---|---|---|
| Standard | 29.920 | 30.260 | 30.430 | 30.770 | 30.940 | 31.280 | 31.450 |
| Camarilla | 30.460 | 30.507 | 30.553 | 30.600 | 30.647 | 30.694 | 30.740 |
| Woodie | 29.835 | 30.218 | 30.345 | 30.728 | 30.855 | 31.238 | 31.365 |
| Fibonacci | 30.260 | 30.455 | 30.575 | 30.770 | 30.965 | 31.085 | 31.280 |
| Pivot points | S3 | S2 | S1 | PP | R1 | R2 | R3 |
|---|---|---|---|---|---|---|---|
| Standard | 19.803 | 24.912 | 27.808 | 32.917 | 35.813 | 40.922 | 43.818 |
| Camarilla | 28.504 | 29.237 | 29.971 | 30.705 | 31.439 | 32.173 | 32.906 |
| Woodie | 18.698 | 24.359 | 26.703 | 32.364 | 34.708 | 40.369 | 42.713 |
| Fibonacci | 24.912 | 27.970 | 29.859 | 32.917 | 35.975 | 37.864 | 40.922 |
| Pivot points | S3 | S2 | S1 | PP | R1 | R2 | R3 |
|---|---|---|---|---|---|---|---|
| Standard | 17.320 | 23.670 | 27.135 | 33.485 | 36.950 | 43.300 | 46.765 |
| Camarilla | 27.901 | 28.801 | 29.700 | 30.600 | 31.500 | 32.399 | 33.299 |
| Woodie | 15.878 | 22.949 | 25.693 | 32.764 | 35.508 | 42.579 | 45.323 |
| Fibonacci | 23.670 | 27.419 | 29.736 | 33.485 | 37.234 | 39.551 | 43.300 |
Numerical data
The following are the details of the technical indicators and moving averages that were collected to generate this technical analysis:
| RSI (14): | 36.62 | |
| MACD (12,26,9): | -0.3000 | |
| Directional Movement: | -10.205 | |
| AROON (14): | -14.285 | |
| DEMA (21): | 30.473 | |
| Parabolic SAR (0,02-0,02-0,2): | 31.223 | |
| Elder Ray (13): | -0.160 | |
| Super Trend (3,10): | 31.401 | |
| Zig ZAG (10): | 30.600 | |
| VORTEX (21): | 0.8610 | |
| Stochastique (14,3,5): | 46.74 | |
| TEMA (21): | 30.833 | |
| Williams %R (14): | -61.96 | |
| Chande Momentum Oscillator (20): | -0.385 | |
| Repulse (5,40,3): | -1.2240 | |
| ROCnROLL: | 2 | |
| TRIX (15,9): | -0.1600 | |
| Courbe Coppock: | 1.30 |
| MA7: | 32.694 | |
| MA20: | 36.452 | |
| MA50: | 37.780 | |
| MA100: | 38.403 | |
| MAexp7: | 30.767 | |
| MAexp20: | 30.949 | |
| MAexp50: | 32.106 | |
| MAexp100: | 33.841 | |
| Price / MA7: | -5.06% | |
| Price / MA20: | -14.85% | |
| Price / MA50: | -17.84% | |
| Price / MA100: | -19.17% | |
| Price / MAexp7: | +0.89% | |
| Price / MAexp20: | +0.29% | |
| Price / MAexp50: | -3.32% | |
| Price / MAexp100: | -8.28% |
About author
Online


Add a comment
Comments
0 comments on the analysis STMICROELECTRONICS - 1H