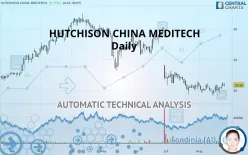
HUTCHMED (CHINA) - Daily - Technical analysis published on 08/26/2019 (GMT)
- 322
- 0
- Who voted?
Click here for a new analysis!
- Timeframe : Daily
- - Analysis generated on
- Status : INVALID

Summary of the analysis

Additional analysis
Quotes
The HUTCHISON CHINA MEDITECH rating is 20.84 USD. The price registered an increase of +0.77% on the session with the lowest point at 20.60 USD and the highest point at 21.21 USD. The deviation from the price is +1.17% for the low point and -1.74% for the high point.Here is a more detailed summary of the historical variations registered by HUTCHISON CHINA MEDITECH:
Near a new HIGH record (1 month)
Type : Bullish
Timeframe : Weekly
Technical
A technical analysis in Daily of this HUTCHISON CHINA MEDITECH chart shows a bearish trend. 71.43% of the signals given by moving averages are bearish. Caution: the neutral signals currently given by short-term moving averages show us that the global trend is losing momentum. An assessment of moving averages reveals a bullish signal that could impact this trend:
Bullish trend reversal : adaptative moving average 20
Type : Bullish
Timeframe : Daily
An assessment of technical indicators shows a slightly bullish signal.
Caution: the Central Indicators scanner currently detects an excess:
CCI indicator is overbought : over 100
Type : Neutral
Timeframe : Daily
Williams %R indicator is overbought : over -20
Type : Neutral
Timeframe : Daily
Parabolic SAR indicator bullish reversal
Type : Bullish
Timeframe : Daily
Aroon indicator bullish trend
Type : Bullish
Timeframe : Daily
Price is back under the pivot point
Type : Bearish
Timeframe : Daily
The analysis of the price chart with Central Patterns scanners does not return any result.
The Central Candlesticks scanner, specialised in Japanese candlesticks, did not identify any signals.
| S3 | S2 | S1 | Price | R1 | R2 | R3 | |
|---|---|---|---|---|---|---|---|
| ProTrendLines | 12.52 | 18.30 | 19.69 | 20.84 | 21.27 | 30.28 | 34.00 |
| Change (%) | -39.92% | -12.19% | -5.52% | - | +2.06% | +45.30% | +63.15% |
| Change | -8.32 | -2.54 | -1.15 | - | +0.43 | +9.44 | +13.16 |
| Level | Major | Minor | Major | - | Major | Major | Minor |
Attention could also be paid to pivot points to set price objectives:
| Pivot points | S3 | S2 | S1 | PP | R1 | R2 | R3 |
|---|---|---|---|---|---|---|---|
| Standard | 19.75 | 20.19 | 20.43 | 20.87 | 21.11 | 21.55 | 21.79 |
| Camarilla | 20.49 | 20.56 | 20.62 | 20.68 | 20.74 | 20.81 | 20.87 |
| Woodie | 19.66 | 20.14 | 20.34 | 20.82 | 21.02 | 21.50 | 21.70 |
| Fibonacci | 20.19 | 20.45 | 20.61 | 20.87 | 21.13 | 21.29 | 21.55 |
| Pivot points | S3 | S2 | S1 | PP | R1 | R2 | R3 |
|---|---|---|---|---|---|---|---|
| Standard | 18.07 | 18.84 | 19.76 | 20.53 | 21.45 | 22.22 | 23.14 |
| Camarilla | 20.22 | 20.37 | 20.53 | 20.68 | 20.84 | 20.99 | 21.15 |
| Woodie | 18.15 | 18.88 | 19.84 | 20.57 | 21.53 | 22.26 | 23.22 |
| Fibonacci | 18.84 | 19.49 | 19.88 | 20.53 | 21.18 | 21.57 | 22.22 |
| Pivot points | S3 | S2 | S1 | PP | R1 | R2 | R3 |
|---|---|---|---|---|---|---|---|
| Standard | 15.33 | 17.35 | 19.13 | 21.15 | 22.93 | 24.95 | 26.73 |
| Camarilla | 19.87 | 20.21 | 20.56 | 20.91 | 21.26 | 21.61 | 21.96 |
| Woodie | 15.21 | 17.29 | 19.01 | 21.09 | 22.81 | 24.89 | 26.61 |
| Fibonacci | 17.35 | 18.80 | 19.70 | 21.15 | 22.60 | 23.50 | 24.95 |
Numerical data
The following is the status of technical indicators and moving averages registered at the time this technical analysis was created:
| RSI (14): | 49.01 | |
| MACD (12,26,9): | -0.4000 | |
| Directional Movement: | -0.16 | |
| AROON (14): | 50.00 | |
| DEMA (21): | 19.90 | |
| Parabolic SAR (0,02-0,02-0,2): | 19.24 | |
| Elder Ray (13): | 0.46 | |
| Super Trend (3,10): | 21.93 | |
| Zig ZAG (10): | 20.81 | |
| VORTEX (21): | 0.9800 | |
| Stochastique (14,3,5): | 73.89 | |
| TEMA (21): | 20.44 | |
| Williams %R (14): | -22.38 | |
| Chande Momentum Oscillator (20): | -0.10 | |
| Repulse (5,40,3): | -1.9500 | |
| ROCnROLL: | -1 | |
| TRIX (15,9): | -0.4300 | |
| Courbe Coppock: | 0.46 |
| MA7: | 20.45 | |
| MA20: | 20.35 | |
| MA50: | 22.36 | |
| MA100: | 25.42 | |
| MAexp7: | 20.50 | |
| MAexp20: | 20.60 | |
| MAexp50: | 22.10 | |
| MAexp100: | 23.96 | |
| Price / MA7: | +1.91% | |
| Price / MA20: | +2.41% | |
| Price / MA50: | -6.80% | |
| Price / MA100: | -18.02% | |
| Price / MAexp7: | +1.66% | |
| Price / MAexp20: | +1.17% | |
| Price / MAexp50: | -5.70% | |
| Price / MAexp100: | -13.02% |
News
Don"t forget to follow the news on HUTCHISON CHINA MEDITECH. At the time of publication of this analysis, the latest news was as follows:
- Chi-Med Initiates a Phase I Trial of HMPL-523 in Patients with Immune Thrombocytopenia (ITP) in China
- Chi-Med Reports 2019 Interim Results and Provides Updates on Key Clinical Programs
- Chi-Med Announces Pricing of Upsized U.S. Public Secondary Offering of American Depositary Shares
- Chi-Med Announces Secondary Offering of American Depositary Shares
- Chi-Med Announces that Surufatinib Phase III SANET-ep Study Has Met its Primary Endpoint at Interim Analysis in Advanced Non-Pancreatic Neuroendocrine Tumors in China and Will Stop Early
About author

Online


Add a comment
Comments
0 comments on the analysis HUTCHMED (CHINA) - Daily