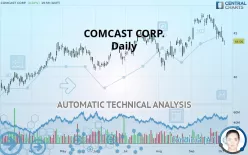
COMCAST CORP. - Daily - Technical analysis published on 10/04/2019 (GMT)
- 399
- 0
- Who voted?
Click here for a new analysis!
- Timeframe : Daily
- - Analysis generated on
- Status : INVALID

Summary of the analysis

Additional analysis
Quotes
The COMCAST CORP. rating is 44.06 USD. The price registered an increase of +0.02% on the session and was between 43.61 USD and 44.17 USD. This implies that the price is at +1.03% from its lowest and at -0.25% from its highest.A bullish opening was detected by the Central Gaps scanner. Buyers are trying to impose a bullish momentum in the very short term.
Bullish opening
Type : Bullish
Timeframe : Openning
Here is a more detailed summary of the historical variations registered by COMCAST CORP.:
Near a new HIGH record (5 years)
Type : Bullish
Timeframe : Weekly
Near a new LOW record (1 month)
Type : Bearish
Timeframe : Weekly
Technical
Technical analysis of COMCAST CORP. in Daily shows a neutral overall trend. This indecision could turn into a bearish trend due to the strong bearish signals currently being given by short-term moving averages. An assessment of moving averages reveals several bearish signals that could impact this trend:
Bearish trend reversal : Moving Average 20
Type : Bearish
Timeframe : Daily
Bearish trend reversal : Moving Average 50
Type : Bearish
Timeframe : Daily
Bearish price crossover with Moving Average 50
Type : Bearish
Timeframe : Daily
In fact, according to the parameters integrated into the Central Analyzer system, 12 technical indicators out of 18 analysed are currently bearish. But beware of excesses. The Central Indicators scanner currently detects this:
CCI indicator is oversold : under -100
Type : Neutral
Timeframe : Daily
Williams %R indicator is oversold : under -80
Type : Neutral
Timeframe : Daily
Price is back under the pivot point
Type : Bearish
Timeframe : Daily
Price is back under the pivot point
Type : Bearish
Timeframe : Weekly
Central Patterns, the market scanner focusing on chart patterns, resistances and supports found these results:
Near horizontal support
Type : Bullish
Timeframe : Daily
Near support of triangle
Type : Bullish
Timeframe : Daily
Support of channel is broken
Type : Bearish
Timeframe : Daily
No result was found by the Central Candlesticks scanner on Japanese candlesticks.
| S3 | S2 | S1 | Price | R1 | R2 | |
|---|---|---|---|---|---|---|
| ProTrendLines | 38.28 | 41.60 | 42.99 | 44.06 | 45.09 | 46.96 |
| Change (%) | -13.12% | -5.58% | -2.43% | - | +2.34% | +6.58% |
| Change | -5.78 | -2.46 | -1.07 | - | +1.03 | +2.90 |
| Level | Intermediate | Intermediate | Major | - | Major | Major |
Attention could also be paid to pivot points to set price objectives:
| Pivot points | S3 | S2 | S1 | PP | R1 | R2 | R3 |
|---|---|---|---|---|---|---|---|
| Standard | 43.14 | 43.55 | 43.80 | 44.22 | 44.47 | 44.88 | 45.13 |
| Camarilla | 43.87 | 43.93 | 43.99 | 44.05 | 44.11 | 44.17 | 44.23 |
| Woodie | 43.05 | 43.51 | 43.72 | 44.17 | 44.38 | 44.84 | 45.05 |
| Fibonacci | 43.55 | 43.80 | 43.96 | 44.22 | 44.47 | 44.63 | 44.88 |
| Pivot points | S3 | S2 | S1 | PP | R1 | R2 | R3 |
|---|---|---|---|---|---|---|---|
| Standard | 41.42 | 42.84 | 43.82 | 45.24 | 46.22 | 47.64 | 48.62 |
| Camarilla | 44.15 | 44.37 | 44.59 | 44.81 | 45.03 | 45.25 | 45.47 |
| Woodie | 41.21 | 42.73 | 43.61 | 45.13 | 46.01 | 47.53 | 48.41 |
| Fibonacci | 42.84 | 43.75 | 44.32 | 45.24 | 46.15 | 46.72 | 47.64 |
| Pivot points | S3 | S2 | S1 | PP | R1 | R2 | R3 |
|---|---|---|---|---|---|---|---|
| Standard | 39.58 | 41.55 | 43.32 | 45.29 | 47.06 | 49.03 | 50.80 |
| Camarilla | 44.05 | 44.39 | 44.74 | 45.08 | 45.42 | 45.77 | 46.11 |
| Woodie | 39.47 | 41.50 | 43.21 | 45.24 | 46.95 | 48.98 | 50.69 |
| Fibonacci | 41.55 | 42.98 | 43.87 | 45.29 | 46.72 | 47.61 | 49.03 |
Numerical data
The following is the status of technical indicators and moving averages registered at the time this technical analysis was created:
| RSI (14): | 38.94 | |
| MACD (12,26,9): | -0.0800 | |
| Directional Movement: | -10.49 | |
| AROON (14): | -71.43 | |
| DEMA (21): | 45.31 | |
| Parabolic SAR (0,02-0,02-0,2): | 45.97 | |
| Elder Ray (13): | -1.22 | |
| Super Trend (3,10): | 46.31 | |
| Zig ZAG (10): | 44.06 | |
| VORTEX (21): | 0.9300 | |
| Stochastique (14,3,5): | 8.09 | |
| TEMA (21): | 44.79 | |
| Williams %R (14): | -87.32 | |
| Chande Momentum Oscillator (20): | -2.61 | |
| Repulse (5,40,3): | -1.8400 | |
| ROCnROLL: | 2 | |
| TRIX (15,9): | 0.1100 | |
| Courbe Coppock: | 7.59 |
| MA7: | 44.75 | |
| MA20: | 45.88 | |
| MA50: | 44.44 | |
| MA100: | 43.65 | |
| MAexp7: | 44.71 | |
| MAexp20: | 45.20 | |
| MAexp50: | 44.68 | |
| MAexp100: | 43.65 | |
| Price / MA7: | -1.54% | |
| Price / MA20: | -3.97% | |
| Price / MA50: | -0.86% | |
| Price / MA100: | +0.94% | |
| Price / MAexp7: | -1.45% | |
| Price / MAexp20: | -2.52% | |
| Price / MAexp50: | -1.39% | |
| Price / MAexp100: | +0.94% |
News
Don"t forget to follow the news on COMCAST CORP.. At the time of publication of this analysis, the latest news was as follows:
- Nielsen And Comcast Agree To Incorporate Set-Top Box Viewing Data Into Local TV Measurement
- Comcast Increases Internet Speeds Across Florida
-
 Comcast CEO Brian Roberts: We Had A Very Strong Third Quarter | CNBC
-
Comcast Q3 Earnings Top Expectations
- Chicago Ideas Week Launches "Hello" in Partnership with Comcast-NBCUniversal
About author

Online


Add a comment
Comments
0 comments on the analysis COMCAST CORP. - Daily