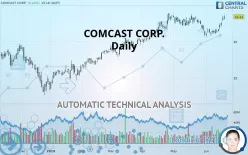
COMCAST CORP. - Daily - Technical analysis published on 06/19/2019 (GMT)
- 466
- 0
- Who voted?
- Timeframe : Daily
- - Analysis generated on
- Status : WITHOUT TARGET

Summary of the analysis

Additional analysis
Quotes
The COMCAST CORP. rating is 43.42 USD. The price registered an increase of +0.39% on the session with the lowest point at 43.07 USD and the highest point at 43.76 USD. The deviation from the price is +0.81% for the low point and -0.78% for the high point.The Central Gaps scanner detects a bullish opening marking the presence of sellers ahead of buyers at the opening but not sufficiently marked to allow the price to register a quotation gap.
Bearish opening
Type : Bearish
Timeframe : Openning
So that you have an overall view of the price change, here is a table showing the variations over several periods:
Near a new HIGH record (5 years)
Type : Bullish
Timeframe : Weekly
Near a new HIGH record (1 year)
Type : Bullish
Timeframe : Weekly
Near a new HIGH record (1st january)
Type : Bullish
Timeframe : Weekly
Near a new HIGH record (1 month)
Type : Bullish
Timeframe : Weekly
Technical
Technical analysis of this Daily chart of COMCAST CORP. indicates that the overall trend is strongly bullish. 89.29% of the signals given by moving averages are bullish. This strongly bullish trend is supported by the strong bullish signals given by short-term moving averages. The Central Indicators scanner detects a bullish signal on moving averages that could impact this trend:
Bullish trend reversal : Moving Average 20
Type : Bullish
Timeframe : Daily
Technical indicators are strongly bullish, suggesting that the price increase should continue.
Caution: the Central Indicators scanner currently detects an excess:
CCI indicator is overbought : over 100
Type : Neutral
Timeframe : Daily
Williams %R indicator is overbought : over -20
Type : Neutral
Timeframe : Daily
Pivot points : price is over resistance 2
Type : Neutral
Timeframe : Weekly
Aroon indicator bullish trend
Type : Bullish
Timeframe : Daily
SuperTrend indicator bullish reversal
Type : Bullish
Timeframe : Daily
MACD indicator is back over 0
Type : Bullish
Timeframe : Daily
An analysis of the price chart with the Central Patterns scanner (detector of chart patterns and resistances and supports) shows a result that can have an impact on the price change:
Resistance of channel is broken
Type : Bullish
Timeframe : Daily
The presence of a bullish Japanese candlestick pattern detected by Central Candlesticks that could cause a very short term rebound was also detected:
Upside gap
Type : Bullish
Timeframe : Daily
| S3 | S2 | S1 | Price | |
|---|---|---|---|---|
| ProTrendLines | 39.42 | 40.96 | 42.99 | 43.42 |
| Change (%) | -9.21% | -5.67% | -0.99% | - |
| Change | -4.00 | -2.46 | -0.43 | - |
| Level | Major | Intermediate | Major | - |
To determine price objectives, it is also possible to use the pivot points. Here is the price position in relation to pivot points:
| Pivot points | S3 | S2 | S1 | PP | R1 | R2 | R3 |
|---|---|---|---|---|---|---|---|
| Standard | 42.27 | 42.61 | 42.93 | 43.27 | 43.59 | 43.93 | 44.25 |
| Camarilla | 43.07 | 43.13 | 43.19 | 43.25 | 43.31 | 43.37 | 43.43 |
| Woodie | 42.26 | 42.60 | 42.92 | 43.26 | 43.58 | 43.93 | 44.24 |
| Fibonacci | 42.61 | 42.86 | 43.02 | 43.27 | 43.52 | 43.68 | 43.93 |
| Pivot points | S3 | S2 | S1 | PP | R1 | R2 | R3 |
|---|---|---|---|---|---|---|---|
| Standard | 39.93 | 40.48 | 41.40 | 41.94 | 42.86 | 43.41 | 44.33 |
| Camarilla | 41.91 | 42.04 | 42.18 | 42.31 | 42.44 | 42.58 | 42.71 |
| Woodie | 40.11 | 40.57 | 41.58 | 42.04 | 43.04 | 43.50 | 44.51 |
| Fibonacci | 40.48 | 41.04 | 41.39 | 41.94 | 42.50 | 42.85 | 43.41 |
Numerical data
The following is the status of technical indicators and moving averages registered at the time this technical analysis was created:
| RSI (14): | 64.79 | |
| MACD (12,26,9): | 0.1200 | |
| Directional Movement: | 14.85 | |
| AROON (14): | 85.71 | |
| DEMA (21): | 42.25 | |
| Parabolic SAR (0,02-0,02-0,2): | 40.97 | |
| Elder Ray (13): | 1.18 | |
| Super Trend (3,10): | 41.30 | |
| Zig ZAG (10): | 43.42 | |
| VORTEX (21): | 0.9700 | |
| Stochastique (14,3,5): | 88.73 | |
| TEMA (21): | 42.26 | |
| Williams %R (14): | -11.69 | |
| Chande Momentum Oscillator (20): | 2.44 | |
| Repulse (5,40,3): | 1.1200 | |
| ROCnROLL: | 1 | |
| TRIX (15,9): | -0.0500 | |
| Courbe Coppock: | 1.29 |
| MA7: | 42.27 | |
| MA20: | 41.97 | |
| MA50: | 42.32 | |
| MA100: | 40.46 | |
| MAexp7: | 42.54 | |
| MAexp20: | 42.17 | |
| MAexp50: | 41.79 | |
| MAexp100: | 40.67 | |
| Price / MA7: | +2.72% | |
| Price / MA20: | +3.45% | |
| Price / MA50: | +2.60% | |
| Price / MA100: | +7.32% | |
| Price / MAexp7: | +2.09% | |
| Price / MAexp20: | +2.99% | |
| Price / MAexp50: | +3.92% | |
| Price / MAexp100: | +6.79% |
News
Don"t forget to follow the news on COMCAST CORP.. At the time of publication of this analysis, the latest news was as follows:
- Nielsen And Comcast Agree To Incorporate Set-Top Box Viewing Data Into Local TV Measurement
- Comcast Increases Internet Speeds Across Florida
-
 Comcast CEO Brian Roberts: We Had A Very Strong Third Quarter | CNBC
-
Comcast Q3 Earnings Top Expectations
- Chicago Ideas Week Launches "Hello" in Partnership with Comcast-NBCUniversal
About author

Online


Add a comment
Comments
0 comments on the analysis COMCAST CORP. - Daily