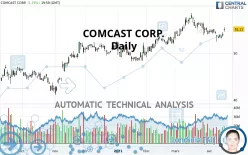
COMCAST CORP. - Daily - Technical analysis published on 04/17/2021 (GMT)
- 350
- 0
Click here for a new analysis!
- Timeframe : Daily
- - Analysis generated on
- Status : TARGET REACHED

Summary of the analysis

Additional analysis
Quotes
The COMCAST CORP. rating is 55.11 USD. The price has increased by +1.79% since the last closing and was between 54.59 USD and 55.50 USD. This implies that the price is at +0.95% from its lowest and at -0.70% from its highest.The Central Gaps scanner detects the formation of a bullish gap marking the strong presence of buyers against sellers at the opening. This formed a quotation gap.
Opening Gap UP
Type : Bullish
Timeframe : Openning
So that you have an overall view of the price change, here is a table showing the variations over several periods:
Near a new LOW record (1 month)
Type : Bearish
Timeframe : Weekly
Technical
Technical analysis of this Daily chart of COMCAST CORP. indicates that the overall trend is strongly bullish. 89.29% of the signals given by moving averages are bullish. The slightly bullish signals given by the short-term moving averages indicate this trend is showing signs of running out of steam. The Central Indicators scanner detects a bullish signal on moving averages that could impact this trend:
Bullish trend reversal : adaptative moving average 50
Type : Bullish
Timeframe : Daily
In fact, 10 technical indicators on 18 studied are currently positioned bullish. Caution: the Central Indicators scanner currently detects an excess:
CCI indicator: bearish divergence
Type : Bearish
Timeframe : Daily
CCI indicator: bullish divergence
Type : Bullish
Timeframe : Daily
MACD indicator: bearish divergence
Type : Bearish
Timeframe : Daily
MACD indicator: bullish divergence
Type : Bullish
Timeframe : Daily
RSI indicator: bearish divergence
Type : Bearish
Timeframe : Daily
RSI indicator: bullish divergence
Type : Bullish
Timeframe : Daily
Williams %R indicator is overbought : over -20
Type : Neutral
Timeframe : Daily
Pivot points : price is over resistance 2
Type : Neutral
Timeframe : Weekly
Pivot points : price is over resistance 3
Type : Neutral
Timeframe : Daily
Pivot points : price is under support 3
Type : Neutral
Timeframe : Daily
Pivot points : price is under support 3
Type : Neutral
Timeframe : Weekly
The Central Patterns scanner, which studies chart patterns, resistances and supports, has identified these signals:
Horizontal resistance is broken
Type : Bullish
Timeframe : Daily
Resistance of triangle is broken
Type : Bullish
Timeframe : Daily
Support of channel is broken
Type : Bearish
Timeframe : Daily
No result was found by the Central Candlesticks scanner on Japanese candlesticks.
| S3 | S2 | S1 | Price | R1 | R2 | |
|---|---|---|---|---|---|---|
| ProTrendLines | 43.00 | 47.50 | 52.39 | 55.11 | 55.46 | 58.04 |
| Change (%) | -21.97% | -13.81% | -4.94% | - | +0.64% | +5.32% |
| Change | -12.11 | -7.61 | -2.72 | - | +0.35 | +2.93 |
| Level | Major | Major | Major | - | Intermediate | Major |
Pivot points can also be used to set your price objectives. Here is the price situation in relation to pivot points:
| Pivot points | S3 | S2 | S1 | PP | R1 | R2 | R3 |
|---|---|---|---|---|---|---|---|
| Standard | 53.72 | 54.16 | 54.63 | 55.07 | 55.54 | 55.98 | 56.45 |
| Camarilla | 54.86 | 54.94 | 55.03 | 55.11 | 55.19 | 55.28 | 55.36 |
| Woodie | 53.75 | 54.17 | 54.66 | 55.08 | 55.57 | 55.99 | 56.48 |
| Fibonacci | 54.16 | 54.50 | 54.72 | 55.07 | 55.41 | 55.63 | 55.98 |
| Pivot points | S3 | S2 | S1 | PP | R1 | R2 | R3 |
|---|---|---|---|---|---|---|---|
| Standard | 51.27 | 52.20 | 53.65 | 54.58 | 56.03 | 56.96 | 58.41 |
| Camarilla | 54.46 | 54.67 | 54.89 | 55.11 | 55.33 | 55.55 | 55.77 |
| Woodie | 51.54 | 52.33 | 53.92 | 54.71 | 56.30 | 57.09 | 58.68 |
| Fibonacci | 52.20 | 53.11 | 53.67 | 54.58 | 55.49 | 56.05 | 56.96 |
| Pivot points | S3 | S2 | S1 | PP | R1 | R2 | R3 |
|---|---|---|---|---|---|---|---|
| Standard | 45.88 | 49.26 | 51.56 | 54.94 | 57.24 | 60.62 | 62.92 |
| Camarilla | 52.30 | 52.82 | 53.34 | 53.86 | 54.38 | 54.90 | 55.42 |
| Woodie | 45.34 | 48.99 | 51.02 | 54.67 | 56.70 | 60.35 | 62.38 |
| Fibonacci | 49.26 | 51.43 | 52.77 | 54.94 | 57.11 | 58.45 | 60.62 |
Numerical data
The following is the status of technical indicators and moving averages registered at the time this technical analysis was created:
| RSI (14): | 53.81 | |
| MACD (12,26,9): | -0.2000 | |
| Directional Movement: | -0.88 | |
| AROON (14): | -64.29 | |
| DEMA (21): | 54.44 | |
| Parabolic SAR (0,02-0,02-0,2): | 52.46 | |
| Elder Ray (13): | 0.63 | |
| Super Trend (3,10): | 56.56 | |
| Zig ZAG (10): | 55.11 | |
| VORTEX (21): | 0.8600 | |
| Stochastique (14,3,5): | 48.55 | |
| TEMA (21): | 53.79 | |
| Williams %R (14): | -15.98 | |
| Chande Momentum Oscillator (20): | 0.13 | |
| Repulse (5,40,3): | 0.8000 | |
| ROCnROLL: | 1 | |
| TRIX (15,9): | -0.0200 | |
| Courbe Coppock: | 5.66 |
| MA7: | 53.95 | |
| MA20: | 54.81 | |
| MA50: | 54.40 | |
| MA100: | 52.49 | |
| MAexp7: | 54.25 | |
| MAexp20: | 54.57 | |
| MAexp50: | 54.01 | |
| MAexp100: | 52.21 | |
| Price / MA7: | +2.15% | |
| Price / MA20: | +0.55% | |
| Price / MA50: | +1.31% | |
| Price / MA100: | +4.99% | |
| Price / MAexp7: | +1.59% | |
| Price / MAexp20: | +0.99% | |
| Price / MAexp50: | +2.04% | |
| Price / MAexp100: | +5.55% |
News
The latest news and videos published on COMCAST CORP. at the time of the analysis were as follows:
- Nielsen And Comcast Agree To Incorporate Set-Top Box Viewing Data Into Local TV Measurement
- Comcast Increases Internet Speeds Across Florida
-
 Comcast CEO Brian Roberts: We Had A Very Strong Third Quarter | CNBC
-
Comcast Q3 Earnings Top Expectations
- Chicago Ideas Week Launches "Hello" in Partnership with Comcast-NBCUniversal
About author

Online


Add a comment
Comments
0 comments on the analysis COMCAST CORP. - Daily