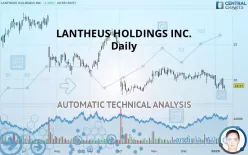
LANTHEUS HOLDINGS INC. - Daily - Technical analysis published on 01/13/2020 (GMT)
- 274
- 0
- Who voted?
Click here for a new analysis!
- Timeframe : Daily
- - Analysis generated on
- Status : TARGET REACHED

Summary of the analysis

Additional analysis
Quotes
The LANTHEUS HOLDINGS INC. price is 19.17 USD. On the day, this instrument gained +2.08% and was between 18.59 USD and 19.21 USD. This implies that the price is at +3.12% from its lowest and at -0.21% from its highest.So that you have an overall view of the price change, here is a table showing the variations over several periods:
Technical
Technical analysis of this Daily chart of LANTHEUS HOLDINGS INC. indicates that the overall trend is strongly bearish. The signals given by moving averages are 92.86% bearish. This strong bearish trend is confirmed by the strong signals currently being given by short-term moving averages. An assessment of moving averages reveals a bearish signal that could impact this trend:
Bearish trend reversal : Moving Average 50
Type : Bearish
Timeframe : Daily
The probability of a further decline is moderate given the direction of the technical indicators.
Caution: the Central Indicators scanner currently detects an excess:
CCI indicator is oversold : under -100
Type : Neutral
Timeframe : Daily
Williams %R indicator is oversold : under -80
Type : Neutral
Timeframe : Daily
SuperTrend indicator bearish reversal
Type : Bearish
Timeframe : Daily
Price is back under the pivot point
Type : Bearish
Timeframe : Daily
Price is back under the pivot point
Type : Bearish
Timeframe : Weekly
Williams %R indicator is back under -50
Type : Bearish
Timeframe : Daily
Central Patterns, the scanner specializing in chart patterns, did not identify any signals.
The presence of a bearish pattern in Japanese candlesticks detected by Central Candlesticks that could cause a correction in the very short term was also detected:
Bearish engulfing lines
Type : Bearish
Timeframe : Daily
| S3 | S2 | S1 | Price | R1 | R2 | R3 | |
|---|---|---|---|---|---|---|---|
| ProTrendLines | 12.68 | 14.84 | 18.52 | 19.17 | 20.15 | 21.54 | 24.30 |
| Change (%) | -33.85% | -22.59% | -3.39% | - | +5.11% | +12.36% | +26.76% |
| Change | -6.49 | -4.33 | -0.65 | - | +0.98 | +2.37 | +5.13 |
| Level | Minor | Minor | Major | - | Major | Major | Major |
To determine price objectives, it is also possible to use the pivot points. Here is the price position in relation to pivot points:
| Pivot points | S3 | S2 | S1 | PP | R1 | R2 | R3 |
|---|---|---|---|---|---|---|---|
| Standard | 16.79 | 17.77 | 18.27 | 19.25 | 19.75 | 20.73 | 21.23 |
| Camarilla | 18.37 | 18.51 | 18.64 | 18.78 | 18.92 | 19.05 | 19.19 |
| Woodie | 16.56 | 17.65 | 18.04 | 19.13 | 19.52 | 20.61 | 21.00 |
| Fibonacci | 17.77 | 18.33 | 18.68 | 19.25 | 19.81 | 20.16 | 20.73 |
| Pivot points | S3 | S2 | S1 | PP | R1 | R2 | R3 |
|---|---|---|---|---|---|---|---|
| Standard | 16.27 | 17.48 | 18.34 | 19.55 | 20.41 | 21.62 | 22.48 |
| Camarilla | 18.62 | 18.81 | 19.00 | 19.19 | 19.38 | 19.57 | 19.76 |
| Woodie | 16.09 | 17.39 | 18.16 | 19.46 | 20.23 | 21.53 | 22.30 |
| Fibonacci | 17.48 | 18.27 | 18.76 | 19.55 | 20.34 | 20.83 | 21.62 |
| Pivot points | S3 | S2 | S1 | PP | R1 | R2 | R3 |
|---|---|---|---|---|---|---|---|
| Standard | 17.61 | 18.56 | 19.53 | 20.48 | 21.45 | 22.40 | 23.37 |
| Camarilla | 19.98 | 20.16 | 20.33 | 20.51 | 20.69 | 20.86 | 21.04 |
| Woodie | 17.63 | 18.57 | 19.55 | 20.49 | 21.47 | 22.41 | 23.39 |
| Fibonacci | 18.56 | 19.29 | 19.74 | 20.48 | 21.21 | 21.66 | 22.40 |
Numerical data
The following is the status of the technical indicators and moving averages at the time of publication of this technical analysis:
| RSI (14): | 41.19 | |
| MACD (12,26,9): | -0.3700 | |
| Directional Movement: | -12.97 | |
| AROON (14): | -100.00 | |
| DEMA (21): | 19.52 | |
| Parabolic SAR (0,02-0,02-0,2): | 20.31 | |
| Elder Ray (13): | -0.83 | |
| Super Trend (3,10): | 21.31 | |
| Zig ZAG (10): | 19.17 | |
| VORTEX (21): | 0.9000 | |
| Stochastique (14,3,5): | 26.69 | |
| TEMA (21): | 19.27 | |
| Williams %R (14): | -76.89 | |
| Chande Momentum Oscillator (20): | -1.44 | |
| Repulse (5,40,3): | -1.9800 | |
| ROCnROLL: | 2 | |
| TRIX (15,9): | -0.1500 | |
| Courbe Coppock: | 12.90 |
| MA7: | 19.32 | |
| MA20: | 20.18 | |
| MA50: | 20.51 | |
| MA100: | 21.18 | |
| MAexp7: | 19.44 | |
| MAexp20: | 19.94 | |
| MAexp50: | 20.43 | |
| MAexp100: | 21.17 | |
| Price / MA7: | -0.78% | |
| Price / MA20: | -5.00% | |
| Price / MA50: | -6.53% | |
| Price / MA100: | -9.49% | |
| Price / MAexp7: | -1.39% | |
| Price / MAexp20: | -3.86% | |
| Price / MAexp50: | -6.17% | |
| Price / MAexp100: | -9.45% |
News
Don"t forget to follow the news on LANTHEUS HOLDINGS INC.. At the time of publication of this analysis, the latest news was as follows:
- Lantheus Enters into Strategic Collaboration with CarThera for Use of Microbubbles in Combination with SonoCloud® System for Treatment of Glioblastoma
- Lantheus Holdings to Host Third Quarter 2019 Earnings Conference Call on October 31, 2019 at 8:00 a.m. Eastern Time
- Velan Comments on Announced Sale of Progenics to Lantheus
- Lantheus to Acquire Progenics to Form a Leading Precision Diagnostics Imaging and Therapeutics Company
- Lantheus Holdings to Host First Quarter 2019 Earnings Conference Call on April 30, 2019 at 8:00 a.m. Eastern Time
About author

Online


Add a comment
Comments
0 comments on the analysis LANTHEUS HOLDINGS INC. - Daily